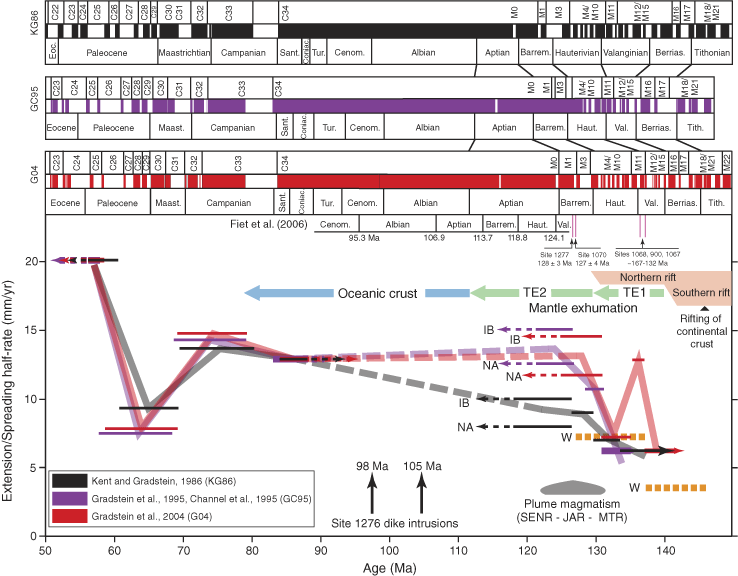
Figure F8. Half-rates for extension/spreading in the Newfoundland-Iberia rift (lower part of figure) calculated from magnetic anomaly identifications of Srivastava et al. (2000) using three different timescales (upper part of figure). The recent Fiet et al. (2006) Cretaceous timescale is shown for comparison (note the very large discrepancy between the G04 and Fiet et al. timescales). In the lower part of the figure the solid horizontal lines (color-coded according to timescale used) show rates calculated on the Newfoundland (NF) and Iberia (IB) plates at the indicated time intervals, or on only one plate where picks were not made on both sides of the rift. Thick color-coded lines show averages and trends of these rates through time, based on the different timescales. Major discrepancies among the three timescales are in the Early Cretaceous, especially for the G04 timescale (see text for discussion). Because of poorly resolved anomalies older than ~M8 (Fig. F7), calculated rates older than this may not be significant. For comparison, two orange dotted lines labeled with a W show extension rates proposed by Whitmarsh et al. (2001), based on geometrical reconstruction of normal faults along the southern margin of the Galicia block. TE1 and TE2 = Transitional Extension periods 1 and 2. Plume magmatism at the southern edge of the rift is represented by the SENR = Southeast Newfoundland Ridge; JAR = J Anomaly Ridge; and MTR = Madeira-Tore Rise. Times of plume magmatism, rifting, mantle exhumation, and seafloor spreading are keyed to the Gradstein et al. (2004) timescale. Drill sites and selected radiometric ages (see Table T1) are indicated.


![]()