Figure Thumbnails 101-125
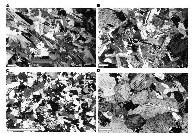
F101. Igneous texture transition to crystal-fabric deformation.
F102. High-temperature crystal-plastic microstructures.
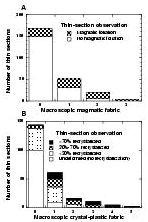
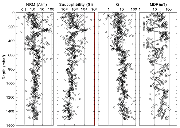
F103. Intensity correlations between macroscopic and microscopic fabrics.
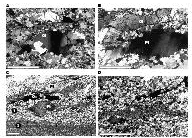
F104. Close-up photographs of microgabbro intrusions.
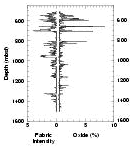
F105. Plot of correlation between oxide presence and crystal-plastic deformation intensity.
F106. Comparison of amphibole veins and crystal-plastic fabric and fault intensity.
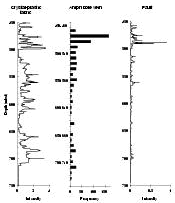
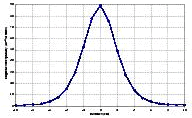
F107. Histogram of the distribution of angles between amphibole veins and crystal-plastic foliations, 450-850 mbsf.

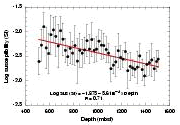
F108. Variation in average magnetic susceptibility.
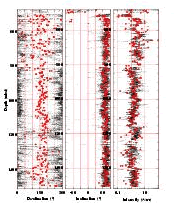
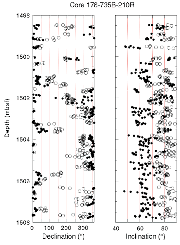
F109. Declination, inclination, and intensity of natural remanent magnetization of gabbroic rocks.
F110. NRM comparison for whole core and archive half.
F111. Histogram of average declinations of NRM and remanence after demagnetization.

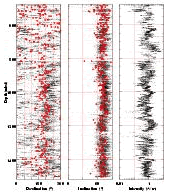
F112. Declination, inclination and intensity of remanence after 20 mT demagnetization.
F113. Variation of NRM, volume susceptibility, Königsberger ratio (Q), and median destructive field from discrete minicore samples.
F114. Distribution of logarithm of NRM, volume susceptibility, Q, and inclination of gabbroic rocks.

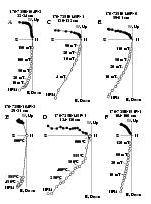
F115. Representative vector end-point diagrams for gabbroic minicore samples with AF and thermal demagnetization results.
F116. Vector end-point diagrams of gabbroic minicore samples, showing radial orientation of the low-stability magnetization component.

F117. Anisotropy of magnetic susceptibility of minicore samples.

F118. Comparison of GRAPE density and bulk density.

F119. Response from functions of the Bartington MS2C sensor.
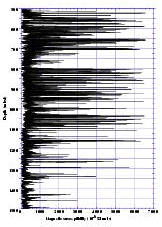
F120. Raw magnetic susceptibility of Hole 735B.
F121. Magnetic susceptibility of Core 176-735B-161R.

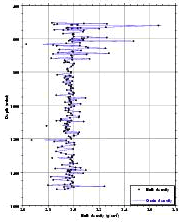
F122. Bulk and grain density of minicores.
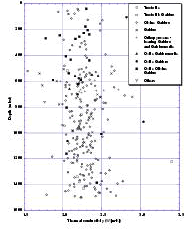
F123. Bulk density of principal lithologies.

F124. Percentage recovery downhole in Hole 735B.

F125. Thermal conductivity of principal lithologies.
![]()