F20. Raw NGR, GRAPE density, and magnetic susceptibility data for Site 1103.
F21. Lithofacies from Site 1103 in magnetic susceptibility vs. NGR space.
F22. GRAPE and MAD bulk density, grain density, and porosity from Site 1100.
F23. GRAPE and MAD bulk density, grain density, and porosity from Site 1103.
F24. PWS3 data for Site 1103.
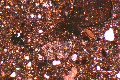
F25. Photomicrograph of Sample 178-1103A-34R-1, 107 cm.
F26. Graphic summary of downhole logging operations at Hole 1103A.
F27. Downhole logs of hole diameter, HSGR, RHOM, IPLC, SGR, sonic velocity, and RMGS from Hole 1103A.
F28. Downhole logs of natural gamma, uranium, thorium, thorium/potassium ratio from NGT, PEF, and magnetic susceptibility in Hole 1103A.
F29. PEF vs. potassium in Hole 1103A.
F30. FMS resistivity images from Hole 1103A.
F31. Magnetic field logs from Hole 1103A.
F32. Temperature log from Hole 1103A.
F33. Comparison of different density data sets available for Site 1103.
F34. Downhole logging and Hamilton Frame velocities for Site 1103.
F35. Traveltime/depth function for Site 1103.
F36. Seismic profile I95-152 over Site 1103 with reflectors marked.
F37. MCS profile I95-152 across Site 1102.
F38. MCS profile I95-152 across Site 1100.
F39. MCS profile I95-152 across Site 1103.
T1. Coring summary for Sites 1100, 1102, and 1103.
T2. Summary of gas concentrations for Hole 1103A.
T3. Profiles of interstitial water chemistry at Hole 1100C.
T4. Summary of logging operations.
M1. QuickTime video (shelf seabed camera survey, Site 1102).