Figure thumbnails 81-86
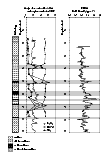
F81. Composite diagram of the first 90 mbsf.
F82. Vertical component of OBS A4's recording of the SDS 12-in fluid hammer drill with concentric winged bits.
F83. The waveform at 22:06:20 on Figure F82, when the hammer drill stalled, plotted on two expanded scales.
F84. Amplitude spectra of drill-string accelerometer measurements at 35 mbsf.
F85. Time series and spectra for a 31-s sample while not drilling in Hole 1105A.
F86. Time series and spectra for a 31-s sample while drilling in Hole 1105A.