![]() F1-F26
F1-F26
![]() T1-T8
T1-T8
F1. Location of Site 1121 and seismic line NIWA 3034.
F2. Part of seismic profile NIWA 3034.
F3. Site 1121 summary log.
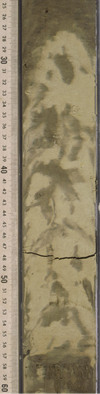
F4. Subunit IA: bioturbation.
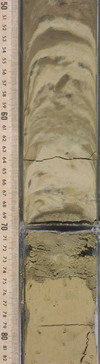
F5. Subunit IA: brownish yellow sand/yellow clay contact.
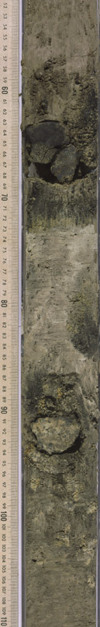
F6. Subunit IA: ferromanganese nodules and sand.
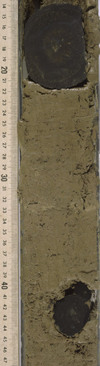
F7. Subunit IA: two ferromanganese crusts.
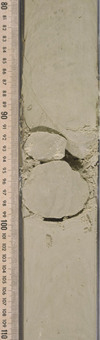
F8. Subunit IB: pale yellow clay with chert nodule.
F9. Biostratigraphic summary chart.
F10. Age assignments based on planktonic diatoms.
F11. Tentative model of oceanic crust subsidence and CCD history.
F12. Relative abundance of diatom valves.
F13. Whole-core magnetic susceptibility and NRM measurements.
F14. MS and NRM from the upper 25 mbsf of Hole 1121B.
F15. Vector component and equal area diagrams.
F16. IRM and backfield acquisition curves.
F17. Plots of normalized intensity of magnetization with progressive AF.
F18. Correlation of magnetic polarity zonations with Geomagnetic Polarity Time Scale.
F19. Age-depth curve.
F20. Depth profiles of interstitial water constituents.
F21. Carbonate contents in sediments.
F22. Index properties measurements.
F23. MST measurements.
F24. Density measurements.
F25. Distribution of shear strength.
F26. Distribution of thermal conductivity and wet-bulk density.
T1. Site 1121 expanded coring summary.
T2. Identification and abundance of nannofossils.
T3. Identification and abundance of foraminifers.
T4. Identification and abundance of diatoms.
T5. Identification and abundance of radiolarians.
T6. Composition of interstitial waters.
T7. Organic chemistry data.
T8. List of index properties measurements.