![]() Figures F1-F38
Figures F1-F38
![]() Tables T1-T17
Tables T1-T17
F1. Map showing Site 1127 in relation to other Leg 182 sites and the AGSO169 site-survey seismic lines.
F2. Portion of seismic Line AGSO169/05a showing seismic stratigraphic sequences at Site 1127.
F3. Lithostratigraphic summary log.
F4. High-frequency sequences showing textural and grain-size changes.
F5. Calcareous nannofossil and planktonic foraminifer zones, and benthic foraminifer assemblages.
F6. Sedimentation rate curve from Site 1127 datum levels.
F7. Downhole inclination from NRM long-core measurements, Hole 1127B.
F8. Normalized intensity decay and demagnetization diagrams.
F9. Long-core measurements.
F10. Plots of AF demagnetization of NRM, ARM, and IRM and of the acquisition of IRM.
F11. Vacutainer gas concentrations from Hole 1127B.
F12. Headspace gas concentrations from Hole 1127B.
F13. CaCO3 and Corg contents in samples from Hole 1127.
F14. Concentration depth profiles of salinity and chlorinity at Hole 1127B.
F15. Concentration depth profiles for Hole 1127B.
F16. Concentration depth profiles for Hole 1127B.
F17. Concentration depth profiles for Hole 1127B.
F18. Alkalinity vs. sulfate/chloride.
F19. Variations in mineral concentrations.
F20. P-wave velocity, uncorrected GRA and MAD bulk density, porosity, NGR, and MS.
F21. GRA bulk density and index properties sample bulk density.
F22. Peak shear strength.
F23. Spectral gamma-ray logs from HNGS for variations in the interval logged through pipe.
F24. Spectral gamma-ray logs from HNGS for the open-hole logged interval.
F25. Conventional geophysical logs vs. depth for the open-hole logged interval.
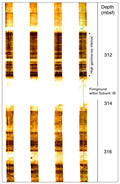
F26. FMS image from Subunit 1B.
F27. FMS image from lower part of Subunit IB.

F28. Downhole variations in borehole temperature.
F29. Seismic site-survey tracks for Sites 1127, 1129, and 1131 in relation to other Leg 182 sites and the AGSO169 site-survey seismic lines.
F30. Portion of seismic Line AGSO169/05a showing interpreted seismic stratigraphic sequences.
F31. Check-shot stations and acquisition geometry for the WST survey at Hole 1129D.
F32. Check-shot stations and acquisition geometry for the WST survey at Site 1131.
F33. Predicted and corrected depths and interval velocities for Site 1127.
F34. Predicted and corrected depths and interval velocities for Site 1129.
F35. Predicted and corrected depths and interval velocities for Site 1131.
F36. Lithostratigraphic units, seismic sequences, biostratigraphic hiatuses, and ages at Site 1127.
F37. Lithostratigraphic units, seismic sequences, biostratigraphic hiatuses, and ages at Site 1129.
F38. Lithostratigraphic units, seismic sequences, biostratigraphic hiatuses, and ages at Site 1131.
![]() Tables T1-T17
Tables T1-T17
T1. Site 1127 coring summary.
T2. Datum levels used for the graph of sedimentation rate.
T3. Composition of gases, Hole 1127B.
T4. Headspace gas composition, Hole 1127B.
T5. C, N, and S data, Hole 1127B.
T6. Interstitial water geochemistry measurements.
T7. XRD data.
T8. P-wave velocity measurements.
T9. GRA-densiometry measurements.
T10. Magnetic susceptibility measurements.
T11. Natural gamma-ray measurements.
T12. Thermal conductivity measurements.
T13. Discrete P-wave velocity.
T14. Index properties measurements.
T15. Undrained shear strength measurements.
T16. Tool strings, intervals logged, and logging speeds, Hole 1127B.
T17. Differences between depths to seismic horizons and corrected depths.