![]() Figures F1-F28
Figures F1-F28
![]() Tables
T1-T19
Tables
T1-T19
F1. Map showing Site 1131 in relation to other Leg 182 sites and the AGSO169 seismic lines.
F2. Portion of seismic Line AGSO169/05a showing seismic stratigraphic sequences at Site 1131.

F3. Site 1131 summary of lithostratigraphy.

F4. Calcareous nannofossil and planktonic foraminifer zones and benthic foraminifer assemblages.
F5. Sedimentation rate curve from datum levels for Site 1131.
F6. Downhole inclination from NRM long-core measurements and after partial demagnetization, with interpreted magnetostratigraphy.

F7. Normalized intensity decay, demagnetization diagrams, and stereoplot of representative samples.
F8. Long-core measurements of declination, inclination, and intensity of remanent magnetization after partial demagnetization.

F9. Acquisition of IRM and its AF demagnetization.
F10. Composite depth section produced using Splicer software.

F11. Spliced section of smoothed color reflectance and NGR data produced using Splicer software.
F12. Headspace gas compositions in samples from Hole 1131A.
F13. CaCO3 and Corg contents in samples from Hole 1131A.
F14. Interstitial water trends.
F15. Concentration depth profiles.
F16. Variations in pH and interstitial water compositions.

F17. Variations in mineral concentrations.

F18. Charge imbalance vs. concentration of Mg2+.
F19. Discrete P-wave velocity, bulk density, porosity, magnetic susceptibility, and NGR measurements.
F20. Maximum shear strength with physical properties units for Hole 1131A.
F21. Thermal conductivity measurements.
F22. Variation of formation temperature with depth.
F23. Summary of spectral gamma-ray logs from the HNGS for the open-hole logged interval.

F24. Summary of spectral gamma-ray logs from the HNGS for the interval logged through pipe.
F25. Summary of triple combo and sonic logs vs. depth for the open-hole logged interval.
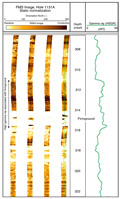
F26. FMS image showing a firmground between Subunits 2A and 2B.
F27. FMS image showing logging Unit 2/Unit 3 boundary and lithostratigraphic Unit II/Unit III boundary.

F28. Downhole variations in borehole temperature.

T1. Site 1131 coring summary.
T2. Datum levels used to calculate the sedimentation rate.
T3. Site 1131 core and section depths in mcd and mbsf.
T4. Site 1131 splice tie points.
T5. Vacutainer gas compositions, Hole 1131A.
T6. Headspace gas compositions, Hole 1131A.
T7. CaCO3, Corg, N, and S data, Hole 1131A.
T8. Interstitial water geochemistry.
T9. XRD data.
T10. P-wave velocity measurements.
T11. GRA-densiometry measurements, Site 113.
T12. Magnetic susceptibility measurements.
T13. Natural gamma-ray measurements.
T14. Thermal conductivity measurements.
T15. In situ formation temperature estimates.
T16. Discrete P-wave velocity measurements.
T17. Index properties measurements.
T18. Undrained shear strength measurements.
T19. Tool strings, intervals logged, and logging speeds; Hole 1131A.