![]() Figures F1-F17
Figures F1-F17
![]() Tables
T1-T9
Tables
T1-T9
F1. Satellite-derived free-air gravity map of the Kerguelen Plateau.
F2. Location of Site 1135 and site-survey data.
F3. Rig Seismic RS180/201 multichannel seismic profile across Site 1135.
F4. Composite stratigraphic section for Site 1135 showing core and lithology summaries.
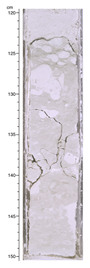
F5. Bed of disturbed light greenish gray calcareous clay that may mark the Cretaceous/Tertiary boundary.
F6. XRD diffractogram of chert.
F7. Site 1135 age-depth plot.
F8. Inclination, intensity, and susceptibility of sediments.
F9. AF demagnetization of whole-core and discrete samples.
F10. Inclination, intensity, and susceptibility from Sections 183-1135A-28R-1 and 28R-2.
F11. Downhole index properties and velocities at Site 1135 correlated with lithologic units.
F12. Crossplot of Vp vs. wet bulk density.
F13. Whole-core measurements of magnetic susceptibility, natural gamma ray, and GRAPE bulk density vs. depth for Site 1135.
F14. Whole-core measurements of magnetic susceptibility, natural gamma ray, and GRAPE bulk density for Core 183-1135A-28R vs. depth for Site 1135.
F15. Comparison of densities determined from core samples and GRAPE, MST, and Vp from downhole logs and core samples.
F16. Composite of core recovery, depth, lithostratigraphy, age, density, and velocity.
F17. Seismic reflection data and a synthetic seismic trace.
T1. Coring summary for Site 1135.
T2. Expanded coring summary for Site 1135.
T3. Summary of lithologic units at Site 1135.
T4. XRD results and total carbonate contents expressed as CaCO3 wt%.
T5. NRM intensity and MST susceptibility from Hole 1135A.
T6. Index properties data from Site 1135.
T7. Vp measured using in discrete sample.
T8. Thermal conductivity values for Site 1135.
T9. Carbon, nitrogen, sulfur, and hydrogen analyses of sediments from Site 1135.