![]() Figures F1-F30
Figures F1-F30
![]() Figures
F31-F60
Figures
F31-F60
![]() Tables
T1-T17
Tables
T1-T17
F1. Satellite-derived free-air gravity map of the Kerguelen Plateau.
F2. Location of Site 1140 and site-survey data.
F3. Marion Dufresne MD109-06 multichannel seismic profile across Site 1140.
F4. Composite stratigraphic section for Site 1140.
F5. Site 1140 age-depth plot.
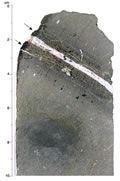
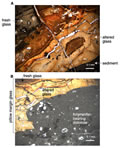
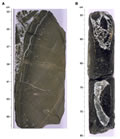
F6. Close-up photograph of interval 183-1140A-26R-1, 0-10 cm.
F7. Vesicle distribution in the thickest lobe of basement Unit 1.
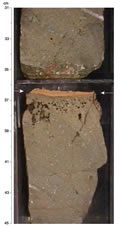
F8. Close-up photograph of interval 183-1140A-32R-2, 126-140 cm.
F9. Vesicle distribution through a segment of basement Unit 3.
F10. Close-up photograph of interval 183-1140A-33R-1, 31-45 cm.
F11. Vesicle distribution through a segment of basement Unit 5.
F12. Vesicle distribution through a segment of basement Unit 6.
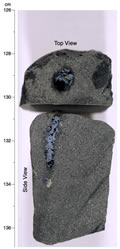
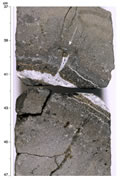
F13. Close-up photograph of interval 183-1140A-35R-2, 37-47 cm, showing a fractured chilled margin in basement Unit 6.
F14. Graph of average lobe thickness in recovered rocks from Hole 1140A.
F15. Interpretative summary of the lithology, morphology, and mineralogy of basaltic lava flows sampled in the basement units at Site 1140.
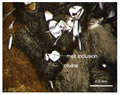
F16. Photomicrograph of the glass from a chilled pillow margin from Unit 1.
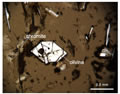
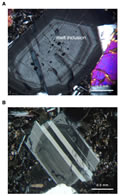
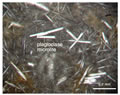
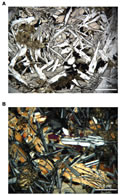
F17. Photomicrographs of plagioclase phenocrysts from a plagioclase-clinopyroxene-olivine-phyric pillow basalt (Unit 2).
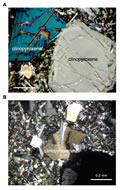
F18. Photomicrograph of clinopyroxene phenocrysts and a glomerocryst.
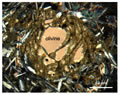
F19. Photomicrograph of a partially altered olivine phenocryst.
F20. Photomicrographs of boundaries in Unit 1.
F21. Photomicrograph of a glassy margin of a pillow lava from Unit 1.
F22. Photomicrograph of the glass from a chilled margin of a pillow lava from Unit 1.
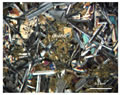
F23. Close-up photograph of a pillow contact breccia from Unit 1.
F24. Photomicrographs of two examples of subophitic texture.
F25. Photomicrograph of a partially altered groundmass olivine.
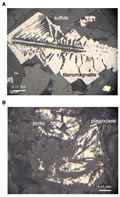
F26. Photomicrographs of skeletal titanomagnetite and secondary pyrite.
F27. Site 1140 igneous rock and basalt samples.
F28. Major element abundances plotted vs. Mg#.
F29. Downcore variations in major element composition for Site 1140 basalts.
F30. Downcore variations in trace element abundances and primitive mantle-normalized ratios.