![]() Figures F1-F30
Figures F1-F30
![]() Figures
F31-F60
Figures
F31-F60
![]() Tables
T1-T17
Tables
T1-T17
F31. Trace element and basalt patterns for Site 1140.
F32. Primitive mantle-normalized Zr/Ti vs. Zr and Zr vs. Nb diagrams.
F33. Nb/Y vs. Zr/Y diagram.
F34. Alteration downhole in Hole 1140A vs. depth.
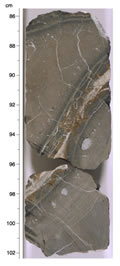
F35. Close-up photograph of Sample 183-1140A-28R-3 (Piece 2, 86-102 cm).
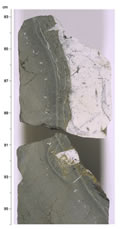
F36. Close-up photograph of Sample 183-1140A-29R-1 (Piece 2, 85-103 cm).
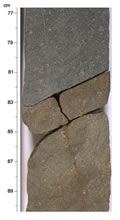
F37. Close-up photograph of Sample 183-1140A-34R-3 (Piece 1, 77-90 cm).
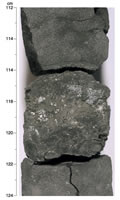
F38. Close-up photograph of Sample 183-1140A-36R-1 (Piece 3, 112-124 cm).
F39. AF demagnetization of a discrete sediment sample.
F40. Inclination, intensity, and susceptibility of sediments.
F41. Average intensity and susceptibility of all units.
F42. Inclination, intensity, and susceptibility of basement rocks.
F43. AF demagnetization of a basement archive half.
F44. Thermal demagnetization of discrete basement samples.
F45. Downhole index properties and Vp.
F46. Downhole index properties profiles for discrete samples from basement Units 2-19.
F47. Downhole profiles of MST measurements together with discrete measurements.
F48. Downhole profile of thermal conductivity.
F49. Comparison of densities determined from core samples and GRAPE, and Vp from downhole logs and core samples.
F50. Comparison of depth vs. TWT relationships for Sites 1140 and 1139.
F51. Composite of core recovery, lithostratigraphy, and age data.
F52. Seismic reflection data and a synthetic seismic trace.
F53. Logging data.
F54. Comparison of densities determined from downhole logs.
F55. Composite of wireline logs compared to the core-derived lithostratigraphy.
F56. Crossplots of density vs. porosity and shallow resistivity vs. Vp.
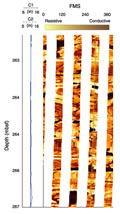
F57. FMS image displaying typical pillow lava structures in basement Unit 2.
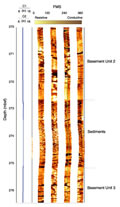
F58. FMS image displaying basement Units 2 and 3.
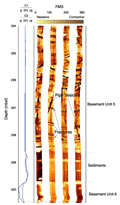
F59. FMS image displaying two sedimentary layers with a intervening lava flow.
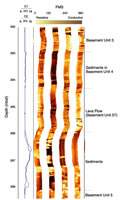
F60. FMS image displaying the transition from basement Units 5-6.
T1. Coring summary.
T2. Expanded coring summary.
T3. Summary of lithologic units.
T4. XRD results, organic carbon, and carbonate contents.
T5. Basement units.
T6. Petrographic summary of igneous units with mineralogies.
T7. X-ray fluorescence analyses of major and trace elements for igneous units.
T8. Secondary minerals within basement units identified by XRD.
T9. Characteristic inclinations and NRM intensities of discrete basalt samples.
T10. Index properties data.
T11. Vp discrete measurements.
T12. Thermal conductivity values.
T13. Carbon, nitrogen, sulfur, and hydrogen analyses of sediments.
T14. Carbon, nitrogen, sulfur, and hydrogen analyses of basalts.
T15. Shotpoints and the measured one-way traveltimes of the check-shot survey.
T16. Summary of logging operations.
T17. Depths of basement unit boundaries from FMS data.