![]() Figures F1-F25
Figures F1-F25
![]() Tables
T1-T15
Tables
T1-T15
F1. Smoothed/correlated MS data and splice.
F2. Smoothed/correlated NGR data and splice.
F3. Smoothed/correlated GRA data and splice.
F4. Smoothed/correlated L* values from the CSR data and splice.
F5. Site 1145 section summary.
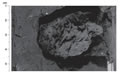
F6. Fecal pellet accumulation replaced by pyrite.
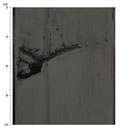
F7. Wood debris.
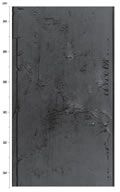
F8. Volcanic ash layer dispersed in burrows.
F9. Peak areas of the major mineral components.
F10. Age-depth plot.
F11. Downhole changes.
F12. Declination and inclination for Hole 1145A, 0-210 mcd.
F13. Representative AF demagnetization diagrams from discrete samples.
F14. Age-depth model, LSR, and MAR.
F15. CaCO3, TOC, and organic C/N ratio vs. depth in Hole 1145A.
F16. Interstitial water measurements.
F17. Bulk density measurements from GRA and MAD methods.
F18. Magnetic susceptibility measurements.
F19. Natural gamma radiation measurements.
F20. Porosity from MAD measurements grain density, and dry density for Hole 1145A.
F21. Color reflectance measurements.
F22. P-wave velocity measurements for Hole 1145A.
F23. Thermal conductivity measurements for Hole 1145A.
F24. Downhole temperature measurements.
F25. Downhole temperature gradient.
T1. Site 1145 coring summary.
T2. Site 1145 coring summary by section.
T3. Composite depths for Site 1145.
T4. Site 1145 splice tie points.
T5. Intervals of lighter colored sediment.
T6. Volcanic ash layers.
T7. Summary of biohorizons.
T8. Calcareous nannofossil checklist.
T9. Planktonic foraminifer checklist.
T10. Age-depth relationship from the magnetic polarity time scale.
T11. Sedimentation and accumulation rates for selected intervals.
T12. IC, CaCO3, TC, TOC, TN, and TS contents.
T13. Rock-Eval pyrolysis results.
T14. Interstitial water composition.
T15. Thermal conductivity measurements.