![]() Figures F1-F2
Figures F1-F2
![]() Tables
T1-T2
Tables
T1-T2
![]() Plates
P1-P9
Plates
P1-P9
F1. Diatom abundance.
F2. Stratigraphic ranges.
T1. Samples processed from Cores 185-1149A-1H through 13H.
T2. Diatom abundance in Cores 185-1149A-1H through 11H.
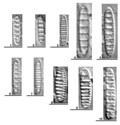
P1. Thalassiosira sp.
P2. Thalassiosira sp.
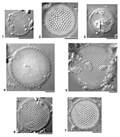
P3. Coscinodiscus sp. and Azpeitia sp.
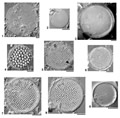
P4. Actinocyclus sp.
P5. Actinoptychus sp.
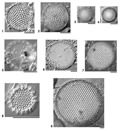
P6. Various diatom species.
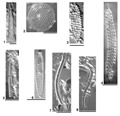
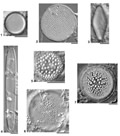
P7. Various diatom species.
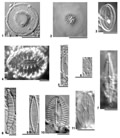
P8. Nitzchia sp. and Pseudoeunotia sp.
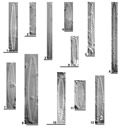
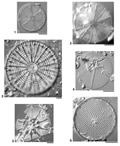
P9. Denticulopsis sp. and Neodenticular sp.