![]() Figures
F1-F6
Figures
F1-F6
![]() Tables T1-T5
Tables T1-T5
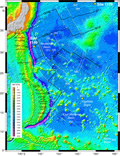
F1. Site 1149 and 1179 locations.
F2. Age spectra plots, Site 1149.
F3. K/Ca ratio plots, Site 1149.
F4. Age spectra plots, Site 1179.
F5. K/Ca ratio plots, Site 1179.
F6. Age-depth plots.
T1. 40Ar/39Ar analysis data, Site 1149.
T2. 40Ar/39Ar analysis data, Site 1179.
T3. Incremental heating data, Site 1149.
T4. Incremental heating data, Site 1179.
T5. Chronostratigraphy.