![]() Figures F1-F27
Figures F1-F27
![]() Tables
T1-T4
Tables
T1-T4
F1. Schematic view of the NEREID borehole geophysical observatory.

F2. Instrument installation technique.
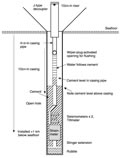
F3. Schematic of the instrument environment at Hole 1151B.
F4. Schematic representation of the basic principles for the Sacks-Evertson strainmeter.

F5. Schematic diagram for the dilatometer deployed in this experiment.

F6. Block diagram of the strainmeter control electronics.
F7. Schematic diagram for the three-component strainmeter.
F8. Outline drawing showing the OBHS components in the canister.
F9. Schematic diagram for the electronics circuits of the CMG-1T sensors.
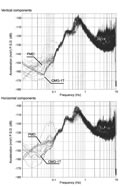
F10. Comparison of seismometer noise for the PMD and CMG.
F11. A schematic representation of the principle of operation of the tilt sensors.
F12. Tiltmeter data from the Nokogiriyama test site.
F13. MEG system block diagram.
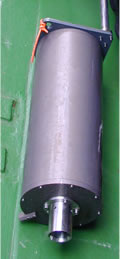
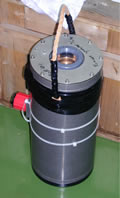
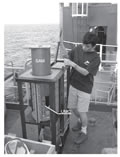
F14. Photograph showing the MEG canister installed in the MEG frame just before they are sent to the seafloor.
F15. Schematic diagram of the DM24.
F16. Photograph of SAM unit for recording up to 72 GB of data.
F17. Photograph of the BOB communication link between ROV and NEREID.
F18. Result of the system power consumption measurement for Hole 1151B system.
F19. SWB1200 cell structure.
F20. Structure of the carbon fiber brush used in the cell cathode.
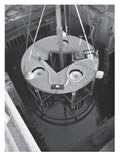
F21. Side-view drawing of the power access terminal (PAT) on top of the reentry cone.
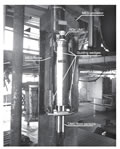
F22. Photograph of the PAT from above the moonpool.
F23. Photograph of the recorder frame with the SAM in place.
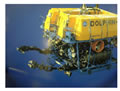
F24. Photograph of the JAMSTEC ROV, Dolphin 3K.
F25. Layout of the existing fiber-optic cable system of the University of Tokyo.
F26. Connection schematics of NEREID systems to the existing fiber-optic cable by use of BUs,. 21
F27. Fiber-optic cable system diagram.
T1. GCF mapping between sensor channels and stream ID.
T2. Available command set for the CRM, DM24s, SAM, and BOB.
T3. Pin assignments of Ocean Design UMCs.
T4. LED chart for BOB's system diagnostics matrix display.