![]() Figures
F1-F50
Figures
F1-F50
![]() Figures
F51-F94
Figures
F51-F94
![]() Tables
T1-T27
Tables
T1-T27
F1. Map of the Japan Trench area off northeast Japan.
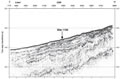
F2. Seismic reflection profile crossing Site 1150.
F3. Schematic of equipment used in the borehole installation at Site 1150.
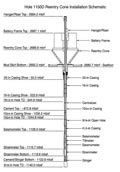
F4.
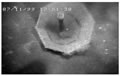
The 10![]() -in casing string
falling into the reentry cone at Hole 1150C.
-in casing string
falling into the reentry cone at Hole 1150C.
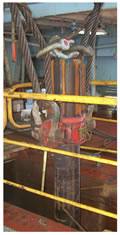
F5. Instrument string configuration hanging in the moonpool area.
F6. The successfully installed battery frame at Hole 1150D.

F7. Lithologic units and color reflectance.

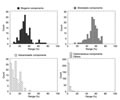
F8. Histogram of the three major sediment types and other components.
F9. Downhole variations of major sediments, other components from smear-slide observations, and minor lithologies.

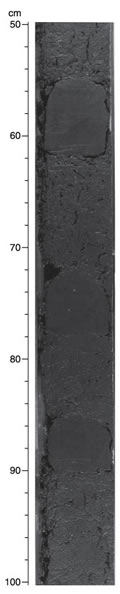
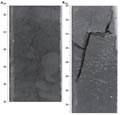
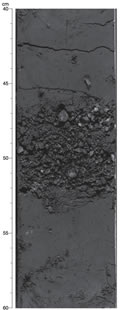
F10. Photograph of typical "coring biscuits" by XCB coring.
F11. Photograph of ichnofossils Planolites, Chondrites, and Zoophycos.
F12. Downhole variations of each lithologic component.
F13. X-ray diffractograms of the major lithology, a minor silt layer, and a dolomitic layer.
F14. Variations of major minerals by XRD.
F15. Variations of color (a*), opal-A, quartz, and 14-Å minerals.
F16. Core-scale cyclic variations of color, GRA density, magnetic susceptibility, and NGR by MST measurement.
F17. Lithification and diagenesis.
F18. Summary of logs at Hole 1150B compared with lithologic units.

F19. Photograph of a typical pumice layer recovered at Site 1150.
F20. Photographs of typical primary ash layers.
F21. Photograph of typical reworked ash layers.
F22. Photograph of typical bioturbated ash "patches".

F23. Photograph of typical reworked ash layers.

F24. Photographs of a dolomite layer and a fragmented dolomite layer.
F25. Split-core paleomagnetic results prior to AF demagnetization.
F26. Ratio of magnetization removed from split cores after 10 mT AF demagnetization along the x-, y-, and z-axes of the core.
F27. Magnetization remaining after AF demagnetization of the split cores.
F28. Split-core declination, inclination, and intensity of magnetization after AF demagnetization.
F29. Histogram of declinations for Cores 186-1150A-3H to 8H before and after Tensor-tool orientation correction.
F30. Split-core and discrete declination, inclination, and intensity of magnetization after AF demagnetization at 20 mT.
F31. Histograms of difference in discrete and split-core inclinations.
F32. Demagnetization behavior of Samples 186-1150A-1H-2, 6 cm, and 186-1150A-1H-2, 24 cm.
F33. Demagnetization behavior of Samples 186-1150A-1H-4, 144 cm, and 186-1150A-1H-5, 6 cm.
F34. Demagnetization behavior of Samples 186-1150A-3H-4, 106 cm, and 186-1150A-3H-6, 106 cm.
F35. Demagnetization behavior of Samples 186-1150A-10H-1, 20 cm, and 186-1150A-12H-2.
F36. Demagnetization behavior of Samples 186-1150A-34X-4, 48 cm, and 186-1150A-69X-1.
F37. Demagnetization behavior of Samples 186-1150B-17R-3, 57 cm, and 186-1150B-28R-2, 16 cm, p. 113. 32
F38. Demagnetization behavior of Samples 186-1150B-35R-1, 73 cm, and 186-1150B-48R-1, 108 cm.

F39. Example of progressive thermal demagnetization of a discrete sample.
F40. Discrete sample results from the NP-2 spinner magnetometer.

F41. Results from the NP-2 spinner magnetometer for discrete samples from the top 120 mbsf of Hole 1150A.

F42. Normalized change in intensity during thermal demagnetization.
F43. Thermal demagnetization of isothermal remanent magnetizations.
F44. IRM acquisition results from Hole 1150A APC cores.

F45. Relative paleointensity for a short interval from the APC cores.
F46. Magnetic properties changes caused by chemical treatments.
F47. Magnetostratigraphic models.
F48. Age-depth relationship.
F49. Sedimentation rate vs. age.
F50. Distribution with depth of headspace concentrations of C1 and C2, and C1/C2 ratios.