![]() Figures
F1-F50
Figures
F1-F50
![]() Figures
F51-F94
Figures
F51-F94
![]() Tables
T1-T27
Tables
T1-T27
F51. Distribution of carbonate, Corg, Corg/N ratios, and S abundances with depth.

F52. Distribution with depth of pore-water geochemical abundances.

F53. Bulk density from GRA measurements.
F54. Horizontal P-wave velocity from PWL measurements, Hole 1150A.

F55. NGR activity.
F56. Thermal conductivity variation with depth, Hole 1150A.
F57. P-wave velocity vs. depth from measurements on split cores.

F58. Anisotropy vs. depth from measurements of vertical and horizontal P-wave velocities, Hole 1150B.
F59. Anisotropy of horizontal P-wave velocity vs. declination, Hole 1150B.

F60. Undrained shear strength variation with depth, Hole 1150A.
F61. Corrections for in situ salinity and pore-water density.
F62. Index properties vs. depth.
F63. Comparison of physical properties from core and log measurements.

F64. Total and effective vertical stress vs. depth at Site 1150.
F65. Porosity vs. mineral composition.
F66. Summary of logging operations.
F67. FMS images across a carbonate zone at 943.3-944.4 mbsf.
F68. FMS images from 985 to 1030 mbsf in Hole 1150B.

F69. Fracture analysis using FMS images from lithologic Units III and IV.

F70. Temperature data vs. time from the APC Adara temperature tool and the DVTP.
F71. Temperature vs. depth, temperature vs. cumulative thermal resistance, and calculated mean heat flow.
F72. Temperature logs recorded in Hole 1150B.
F73. Crossplot of shallow resistivity vs. spectral gamma ray.
F74. Core-log seismic integration at Site 1150.
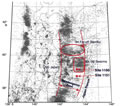
F75. A portion of the seismic section from Line 1 of cruise KH96-3 crossing Site 1150 together with synthetic seismogram.
F76. Seismic activity of the Japan Trench area off northeast Japan.
F77. Logging data of bulk density and P-wave velocity.
F78. Cable link between the borehole and seafloor.
F79. Battery frame bridal assembly.
F80. Array of emplaced instruments from bottom to top in Hole 1150D.
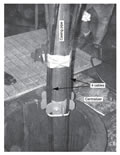
F81. Stinger strainmeter coupling tube assembly.
F82. The PAT and the SAM.

F83. Plan of future cable connection to land.

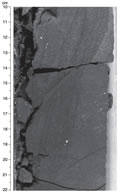
F84. Photograph of a set of steep-dipping, parallel-anastomosing normal faults.
F85. Photograph of thin normal faults crosscutting and displacing an anastomosing parallel joint set.
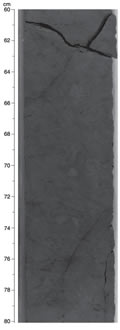
F86. Photograph of a strongly anastomosing, closely spaced parallel joint set.
F87. Number of fractures with depth, Hole 1150B.
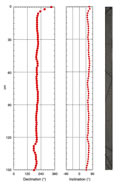
F88. Declination, inclination (after 30 mT demagnetization), and core image of Section 186-1150B-30R-2.
F89. Stereoplot of planes of healed fractures reoriented using paleomagnetic declination, Cores 186-1150B-23R through 25R.
F90. Frequency of healed fractures and distribution of dip azimuth and dip angle of healed fracture planes after reorientation, Hole 1150B.
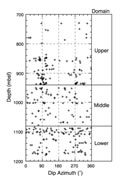
F91. Downhole variation in dip azimuths of healed fracture planes in Hole 1150B, subdivided into domains.
F92. Contour diagram of poles of healed fracture planes in Hole 1150B, subdivided into domains.
F93. Contour diagram of poles of open fracture planes in Hole 1150B, subdivided into domains.

F94. Bedding orientation from Hole 1150B.
T1. Site 1150 coring summary.
T2. XRD data.
T3. Number of ash layers.
T4. Number of pebbles, granules, and sand/silt grains and accumulations.
T5. Occurrences of dolomitic layers.
T6. Stratigraphic occurrence and chronology of datum levels of calcareous nannofossils.
T7. Distribution and relative abundance of selected diatom species.
T8. Stratigraphic occurrence and chronology of datum levels of diatoms.
T9. Depths of prominent geomagnetic reversals.
T10. NRM and ARM results from the NP2 magnetometer before and after AF demagnetization.
T11. NRM results from the NP2 magnetometer before and after AF demagnetization.
T12. Results of chemical treatments.
T13. Age control points for datum events and sedimentation rates.
T14. Headspace concentrations of light hydrocarbons.
T15. Results of gas pocket analyses.
T16. Results of interstitial water analyses.
T17. Thermal conductivity, Hole 1150A.
T18. P-wave velocity and anisotropy.
T19. Undrained shear strength, Hole 1150A.
T20. Index properties.
T21. Summary of logging operations.
T22. Summary of in situ temperature measurements, Hole 1150A.
T23. Instrument package deployment.
T24. ROV tasks to start the NEREID system.
T25. Number of deformational structures, Hole 1150B.
T26. Orientations of healed fractures, Hole 1150B.
T27. Orientations of open fractures, Hole 1150B.