![]() Figures F1-F40
Figures F1-F40
![]() Figures
F41-F50
Figures
F41-F50
![]() Tables
T1-T23
Tables
T1-T23
F1. Map of the Japan Trench area off northeast Japan.
F2. Seismic reflection profile section crossing near Site 1151 in east-west direction.
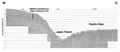
F3. Seismic reflection profile section crossing near Site 1151 in north-south direction.

F4. Schematic of borehole installation at Site 1151.

F5. Site 1151 lithologic units.
F6. Variation of L*, a*, and b* values from handheld color reflectance measurement.
F7. Occurrence of volcanogenic minor lithologies.
F8. Number of sandy and silty layers and patches at Site 1151.
F9. Variations of components from smear-slide observations, Site 1151.
F10. Variations of major minerals by XRD analysis, Site 1151.
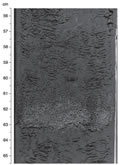
F11. Photograph showing typical siliceous sponge aggregates.
F12. Photograph showing typical glauconitic sand-scattering intervals recovered at Site 1151.
F13. Photograph showing glauconitic sand-rich intervals recovered from Hole 1151A.
F14. Photograph showing typical primary tephra (ash) layer.
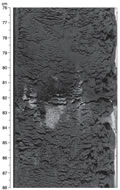
F15. Photograph showing typical bioturbated tephra ("ash patches").
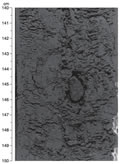
F16. Photograph showing a typical dark gray surrounded pebble-sized pumice grain.
F17. Photograph showing calcareous layers in minor lithology.
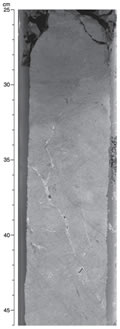
F18. Photograph showing nodule-like white and light gray calcareous concretions.
F19. Split-core inclination and intensity of magnetization after AF demagnetization, and whole-core susceptibility for Hole 1151A.
F20. Split-core inclinations for Holes 1151C and 1151D after AF demagnetization.
F21. Split-core intensity of magnetization for Holes 1151C and 1151D after AF demagnetization.
F22. Whole-core susceptibility for Holes 1151C and 1151D.
F23. Discrete sample results from the NP2 spinner magnetometer.
F24. Age-depth relationship.
F25. Sedimentation rate vs. age.
F26. Distribution with depth of headspace concentrations of C1 and C2, and C1/C2 ratios.
F27. Distribution of carbonate, Corg, and S abundances and Corg/N ratios with depth.
F28. Distribution with depth of pore-water geochemical concentrations.
F29. Bulk density from GRA measurements.
F30. Horizontal P-wave velocity from PWL measurements.
F31. NGR activity.
F32. Thermal conductivity variation with depth, Hole 1151A.

F33. P-wave velocity vs. depth from measurements on split cores, Hole 1151A.
F34. Anisotropy vs. depth from measurements of vertical and horizontal P-wave velocities, Hole 1151A.
F35. Corrections for in situ salinity and pore-water density, Hole 1151A.
F36. Index properties vs. depth, Hole 1151A.
F37. Vertical stress vs. depth, Site 1151.

F38. Summary of logs from Hole 1151D compared with the lithologic units.
F39. Temperature data vs. time from the Adara temperature tool and the DVTP.
![]()
F40. Temperature vs. depth.