![]() Figures F1-F32
Figures F1-F32
![]() Tables
T1-T19
Tables
T1-T19
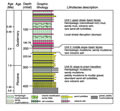
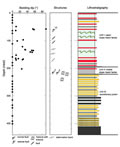
F1. Stratigraphic column, Site 1176.
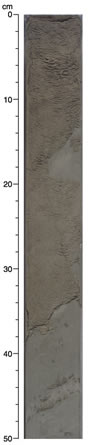
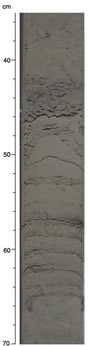
F2. Chaotic and inclined interbeds of volcanic ash and silty clay in Unit I.
F3. Distribution and thickness of volcanic ash layers.
F4. Volcanic ash from Unit I.
F5. Cycle of silty sand turbidites and gray-green silty clay from Unit I.
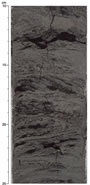
F6. Cross-laminae in silty sand from Unit III.
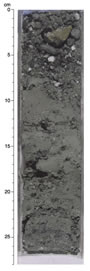
F7. Quartz pebbles and lithic clasts in muddy matrix from Unit III.
F8. Abundance of total clay minerals, quartz, plagioclase, and calcite.
F9. Bedding dips relative to the core liner plotted vs. depth.
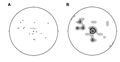
F10. Stereographic projections of bedding in Units I and II.
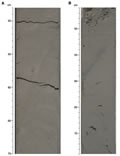
F11. Examples of small faults.
F12. Uncalibrated gas-permeability results.
F13. Paleomagnetic declination, inclination, and intensity.
F14. Magnetostratigraphy.
F15. Age-depth plot.
F16. Pore fluid compositions as a function of depth.
F17. Composition, concentrations, and distributions of headspace gases measured in sediments.
F18. TOC, S, and methane concentrations.
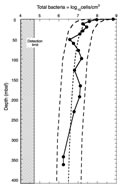
F19. Depth distribution of total bacterial populations in sediment samples.
F20. Bulk density, grain density, and porosity.
F21. Undrained peak shear strength.
F22. Thermal conductivity and temperature trends.
F23. P-wave velocity and impedance.
F24. Formation factor.
F25. Magnetic susceptibility.
F26. Natural gamma ray.
F27. Temperatures measured during the deployment of the APC temperature tool.
F28. Temperatures measured in Hole 1176A during the DVTP stations.
F29. Temperature measurements suspected to be lowered by infiltration of seawater.
F30. Temperatures vs. depth.
F31. Pressure record from the DVTP-P run at 248.5 mbsf.
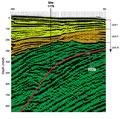
F32. Three-dimensional seismic reflection line.
T1. Coring summary.
T2. Coring summary by section.
T3. Summary of stratigraphic relations.
T4. Peak intensities and peak areas from XRD analysis of sediments.
T5. Relative mineral abundance based on XRD analysis of sediments.
T6. XRD analysis of volcanic ash.
T7. Structural data.
T8. Recognized nannofossil events.
T9. Interval and depth constraints of calcareous nannofossil events.
T10. Calcareous nannofossil range chart.
T11. Depths and ages of magnetic chrons and subchrons.
T12. Pore fluid composition.
T13. Headspace analyses.
T14. Carbon, nitrogen, sulfur, and hydrogen analyses.
T15. Total bacterial populations in sediments.
T16. Comparison of near-surface sediment bacterial populations.
T17. Formation factor obtained by the needle-probe method.
T18. Electrical conductivity and formation factor obtained for sample cubes.
T19. Summary of downhole temperature measurements.