![]() Figures F1-F37
Figures F1-F37
![]() Tables
T1-T9
Tables
T1-T9
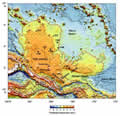
F1. Predicted bathymetry of the Ontong Java Plateau.
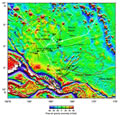
F2. Free-air gravity map of the Ontong Java Plateau region.
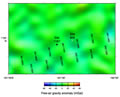
F3. Site 1187 location and site-survey data.
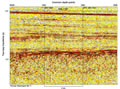
F4. SCS reflection profile.
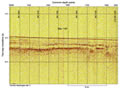
F5. SCS reflection profile.
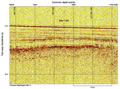
F6. SCS reflection profile.
F7. Lithostratigraphic summary.
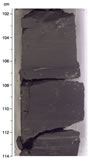
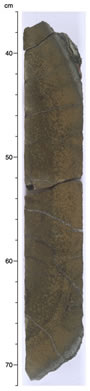
F8. Burrow-mottled claystone.
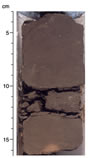
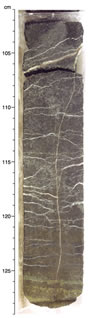
F9. Laminated claystone.
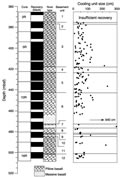
F10. Cores, recovery, rock types, lithologic units, and cooling unit size.
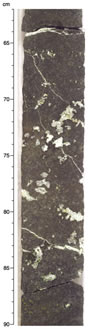
F11. Recrystallized limestone separating units.
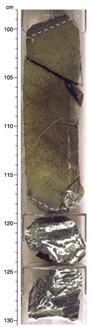
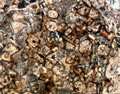
F12. Calcite-cemented hyaloclastite.
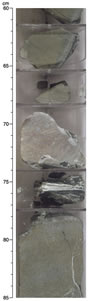
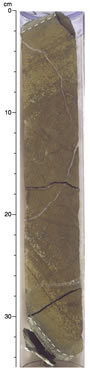
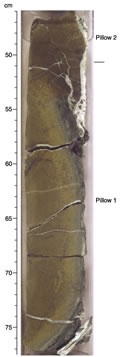
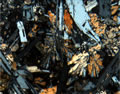
F13. Vertical section through a pillow.
F14. Breakout pillow.
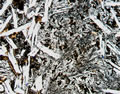
F15. Altered sperulites in quenched pillow margin.
F16. Olivine phenocrysts partially altered to smectite.
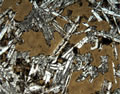
F17. Chrome spinel inclusions in unaltered olivine.
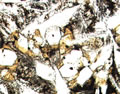
F18. Variolitic to subophitic texture in pillow interior.
F19. Microcrystalline variolitic and coarser-grained patches in groundmass.
F20. Total alkalies vs. silica.
F21. Cr vs. TiO2.
F22. Zr vs. TiO2.
F23. TiO2 vs. Mg#.
F24. Yellow-brown alteration in basalt near pillow margin.
F25. Replacement of olivine phenocryst by smectite.
F26. Replacement of groundmass by smectite.
F27. Miarolitic cavities in basalt with alteration halos.
F28. Miarolitic cavity in basalt filled with smectite, calcite, and goethite.
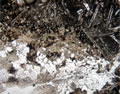
F29. Halo surrounding miarolitic cavity.
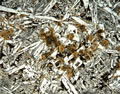
F30. Partially altered olivine crystals preserving incipient alteration to brown smectite.
F31. Pervasively altered basalt grading in color toward pillow interior.
F32. Zijderveld diagrams.
F33. Magnetic inclination variation with depth.
F34. ChRM inclination, NRM intensity, and MDF.
F35. Index properties.
F36. Velocity data and whole-core measurements.
F37. Bulk density profiles comparison.
T1. Coring summary.
T2. Expanded coring summary.
T3. Planktonic foraminifer and calcareous nannofossil occurrences.
T4. Unit characteristics and boundary definitions.
T5. Geochemical data for rock samples, Hole 1187A.
T6. ChRM direction, NRM, MDF, magnetic susceptibility, and Q-ratio.
T7. Index properties data.
T8. P-wave velocity.
T9. Thermal conductivity values.