![]() Figures F1-F50
Figures F1-F50
![]() Figures
F51-F100
Figures
F51-F100
![]() Figures
F101-F154
Figures
F101-F154
![]() Tables
T1-T23
Tables
T1-T23
F101. Fragments of flow-banded altered volcanic rock.

F102. Brecciation, alteration, and quartz-pyrite veining of completely altered volcanic rock.

F103. Distribution of veins according to mineralogy vs. lithologic units, Hole 1189A.
F104. Network of quartz-pyrite veins crosscutting silica-clay alteration.

F105. Vein textures, Hole 1189A.

F106. Distribution of vein thicknesses, vein dip, and dip of veins vs. depth, Hole 1189A.
F107. Dip of primary volcanic layering and plunge of stretched vesicles vs. depth, Hole 1189B.
F108. Matrix-supported breccia.

F109. Clast-supported breccia cut by dense silica vein network.

F110. Photomicrograph and sketch of vein network and jigsaw-fit breccia in altered, flow-banded volcanic rock.

F111. Vein network and brecciated, silicified volcanic rock.

F112. Network of silica veins with alteration halos cutting flow-banded volcanic rock.

F113. Distribution of veins according to mineralogy, Hole 1189B.

F114. Distribution of veins according to mineralogy vs., lithologic units, Hole 1189B.

F115. Quartz-anhydrite vein network and later anhydrite vein crosscutting highly altered volcanic rock.

F116. Distribution of vein thicknesses, veins in different intervals of dip, and dip of veins vs. depth, Hole 1189B.
F117. Downhole variations in major element oxides and trace elements, Hole 1189A.
F118. Downhole variations in major element oxides and trace elements, Hole 1189B.

F119. Observations of cultivation experiment.
F120. Microphotographs and schematic images of epifluorescence observations of aerobic culture after 2 weeks of incubation.

F121. Microphotographs and schematic images of epifluorescence observations of anaerobic cultures after 4 weeks of incubation.

F122. Microphotographs of transparent rectangular crystals and flaky brown translucent clusters showing bacterial habitation.

F123. Microphotographs showing possible bacterial habitation.

F124. Magnetic susceptibility.
F125. Natural gamma radiation.
F126. Compressional wave velocity.
F127. Thermal conductivity.
F128. Grain density.
F129. Porosity.

F130. Volume susceptibility of archive-half core samples.
F131. Remanent intensity of archive-half core samples.

F132. Magnetic susceptibility of minicore samples.
F133. Anisotropy of magnetic susceptibility, Holes 1189A and 1189B.
F134. Natural remanent magnetization intensity of minicore samples.
F135. Stable inclination of minicore samples.
F136. Zijderveld plot and intensity-decay curve of sample with irregular demagnetization behavior.
F137. Intensity of isothermal remanent magnetization, Hole 1189A.

F138. Intensity of isothermal remanent magnetization, Hole 1189B.
F139. Thermal demagnetization of isothermal remanent magnetization.
F140. Heave records for the second and third wireline logging runs, Hole 1189B.
F141. Downhole wireline logs, Hole 1189B.

F142. Temperature records obtained with the wireline cable sensor during all the logging runs, Hole 1189B.

F143. WSTP temperature record of a deployment to 132 mbsf, Hole 1189B.

F144. FMS images of the topmost logged section of Hole 1189B showing the presence of conductive minerals.

F145. A change in alteration as seen in the FMS images, Hole 1189B.
F146. Alternating conductive and resistive thin and shallowly dipping units, Hole 1189B.

F147. Steep fractures in a potentially faulted zone, Hole 1189B.

F148. FMS images showing the bottom of the logged interval, Hole 1189B.

F149. Heave records for the two wireline runs made at Hole 1189C.
F150. Wireline and LWD logs for Hole 1189C.
F151. Temperature and pressure records for the temperature log obtained with the UHT-MSM probe in Hole 1189C.

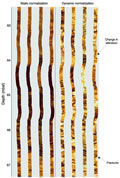
F152. RAB static and dynamic images of Hole 1189C showing subhorizontal fractures and various resistive features.

F153. RAB images showing a deeper section with more resistive features and conductive fractures, Hole 1189C.

F154. Comparison between RAB and FMS images in Hole 1189C.

![]() Figures F1-F50
Figures F1-F50
![]() Figures
F51-F100
Figures
F51-F100
![]() Figures
F101-F154
Figures
F101-F154
![]() Tables
T1-T23
Tables
T1-T23