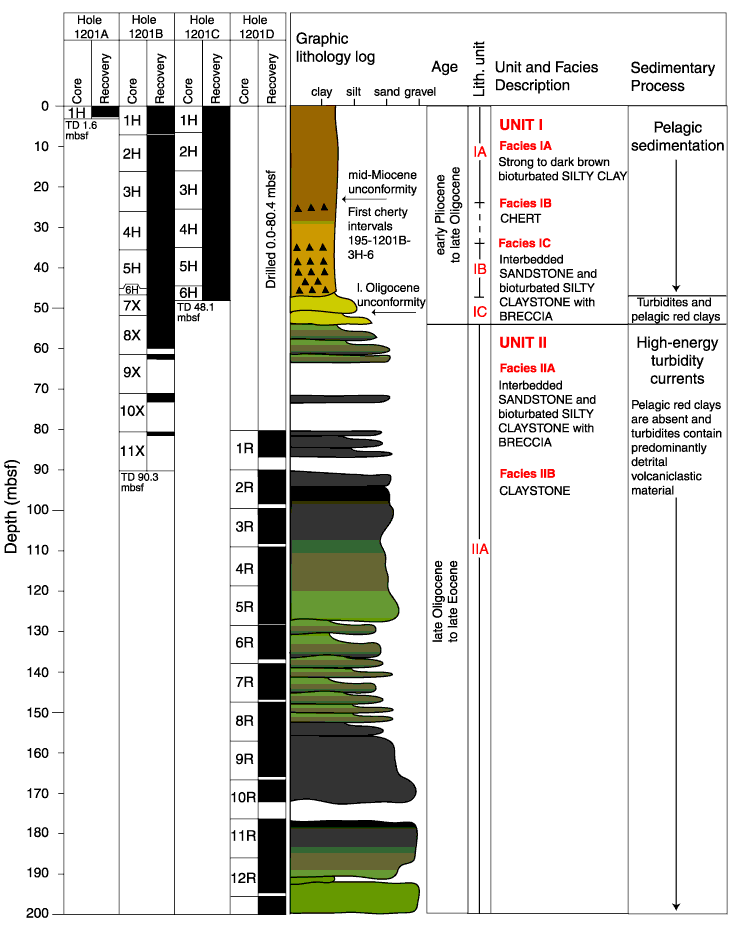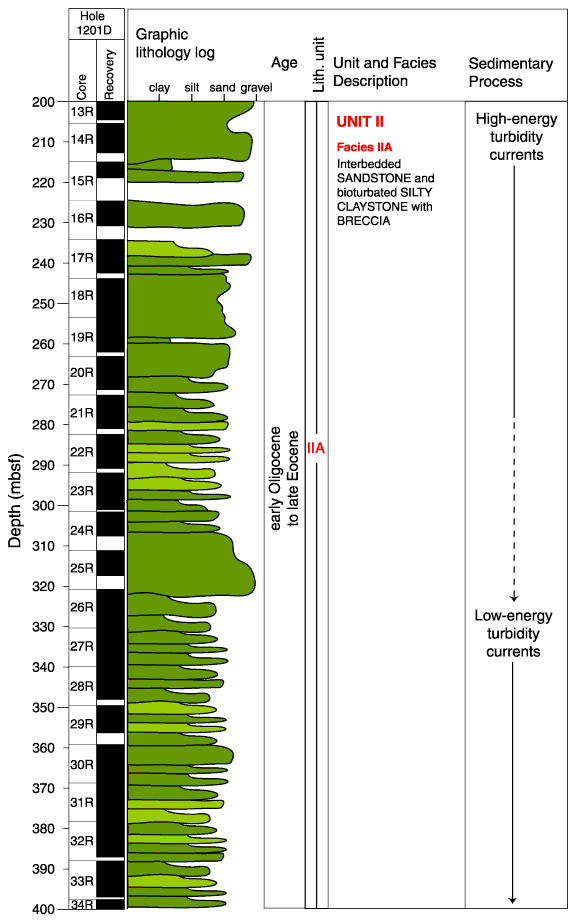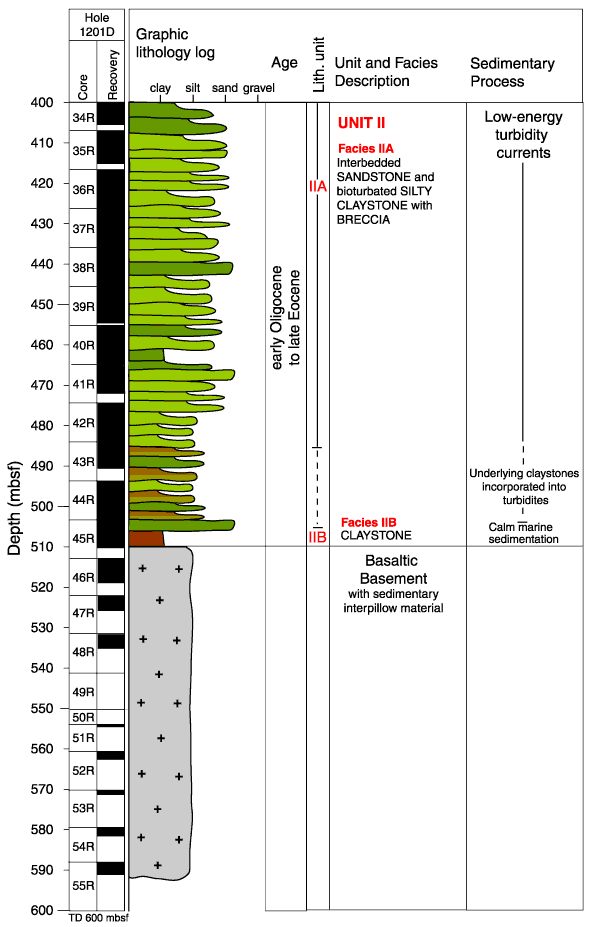
Figure F5.
Representative graphic lithology log for Site 1201 including recovery, age, unit
and facies descriptions, and sedimentary processes. Individual fining-upward
sequences are not drawn to scale. For more detailed graphic logs, see Figures F10
and F12. TD =
total depth.


![]()