![]() Figures F1-F54
Figures F1-F54
![]() Tables
T1-T4
Tables
T1-T4
F1. Topographic highs, western Pacific Basin.
F2. Location of sites.
F3. Magnetic lineations and trace of the hotspot.
F4. Reconstruction of the position of Shatsky Rise.
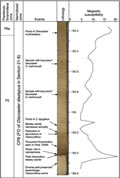
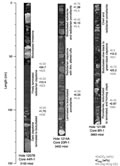
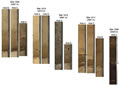
F5. Lithologic columns showing age, lithology, and unconformities.
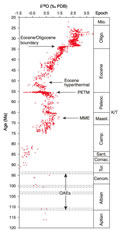
F6. Benthic foraminiferal oxygen isotopic composition vs. age.
F7. Carbon and oxygen isotope values of planktonic and benthic foraminifers, upper Paleocene.
F8. DSDP/ODP isotope data, Albian to Maastrichtian.
F9. Mid-Cretaceous record, black shales and OAEs.
F10. Worldwide volume of oceanic plateaus, seamount chains, and continental flood basalts plotted as a function of geologic time.
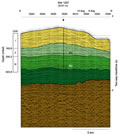
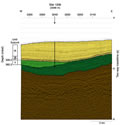
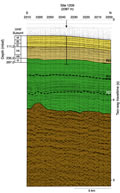
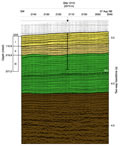
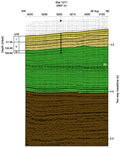
F11. Interpretation of seismic reflection profile, Site 1207.
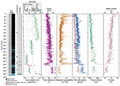
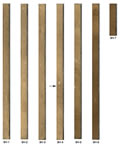
F12. Coring results, Hole 1207A.
F13. Changes in ocean circulation that led to cycles in the upper Miocene to Holocene section.
F14. Hypothesized sequence of events that produced the major Campanian-Miocene unconformity, Northern High of Shatsky Rise.
F15. Interpretation of a seismic reflection profile, Site 1208.
F16. Coring results, Hole 1208A.
F17. Change in circulation in North Pacific associated with closure of the Indonesian Seaway.
F18. Interpretation of the evolution of a stratigraphic section, Site 1208.
F19. Interpretation of a seismic reflection profile, Site 1209.
F20. Coring results, Site 1209.
F21. Stratigraphy and lithologic succession.
F22. Paleontological summary, PETM interval.
F23. Paleontological summary of the K/T boundary, Holes 1209A and 1209C.
F24. Cores that contain the appearance and sudden disappearance of prisms of Inoceramus.
F25. Interpretation of a seismic reflection profile, Site 1210.
F26. Coring results, Site 1210.
F27. Comparison of magnetic susceptibility records, Holes 1210A and 1210B.
F28. Total reflectance records for the E/O boundary interval at four sites.
F29. Interpretation of a seismic reflection profile, Site 1211.
F30. Coring results, Site 1211.
F31. Age-depth curves, Sites 1209-1212.
F32. Lithology of E/O boundary interval.
F33. Correlation of PETM sections.
F34. Lithostratigraphic summary.
F35. Coring results, Site 1212.
F36. Interpretation of a seismic profile, Site 1213.
F37. Generalized chert color by age.
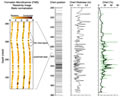
F38. Lithology, carbonate, organic carbon, and pyrolysis hydrogen indices, lower Aptian sedimentary rocks.
F39. Total reflectance records, P/E boundary interval.
F40. Percentage estimates of biosiliceous material from smear slides plotted vs. depth.
F41. Sediment containing diagenetic "green bands,".
F42. Age-depth plots, Sites 1207-1214.
F43. Mass accumulation rates for bulk sediment and carbonate fraction.
F44. Age-depth plots for Leg 198 sites constructed using the Cande and Kent (1995) timescale.
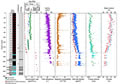
F45. Downhole gamma radiation and resistivity logs, Holes 1207B and 1213B.
F46. Chert layers, Hole 1207B.
F47. Magnetic susceptibility data for uppermost Cretaceous to lower Eocene interval.
F48. Spliced magnetic susceptibility data vs. depth.
F49. Total color reflectance data plotted with orbital obliquity and eccentricity.
F50. Sedimentation rate, mass accumulation rate, SO42- reduction, NH4+ production, and CH4 generation.
F51. Oxygen and hydrogen indices plotted on a modified van Krevelen diagram.
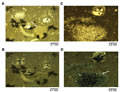
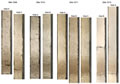
F52. K/T boundary.
F53. PETM on Shatsky Rise.
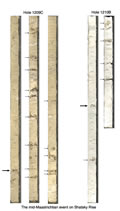
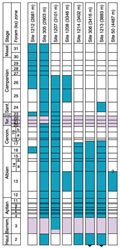
F54. Stratigraphy of Cretaceous sections.
T1. Operations summary.
T2. Locations, depths, maximum ages, and ages of major unconformities.
T3. Comparison of interval thickness and sedimentation rate.
T4. Elemental compositions, carbonate contents, and results from Rock-Eval pyrolysis.