![]() Figures F1-F32
Figures F1-F32
![]() Tables T1-T13
Tables T1-T13
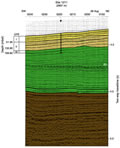
F1. Interpretation of seismic reflection profile, Site 1211.
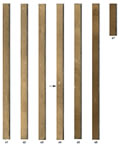
F2. Coring results, Site 1211.
F3. Age-depth curves.
F4. Lithology of the E/O boundary interval.
F5. Correlation of PETM sections.
F6. Core recovery, lithology, lithologic units, age with corresponding biostratigraphic zonations, color reflectance, and percent carbonate, Hole 1211B.
F7. Comparison of color reflectance data of Unit I sediments, Holes 1209A and 1211B.
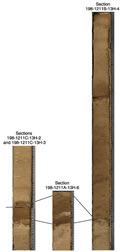
F8. Composite digital photograph, magnetic susceptibility, and color reflectance for the Unit I/II boundary interval, Hole 1211B.
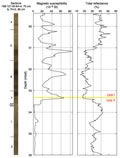
F9. Hole 1211B color reflectance and magnetic susceptibility data for the majority of the interval spanning Unit II and the upper portion of Unit III.
F10. Archive-half magnetization intensities after AF demagnetization at peak fields of 20 mT.
F11. Inclination after AF demagnetization at peak fields of 20 mT.
F12. Age-depth curve derived from magnetic stratigraphy.
F13. Magnetic susceptibility and GRA bulk density data.
F14. Magnetic susceptibility data, 0 to 28 mcd.
F15. Age-depth plot of calcareous nannofossil and planktonic foraminiferal datums.
F16. Age-depth plot of Neogene calcareous nannofossil and planktonic foraminiferal datums.
F17. Age-depth plot of middle Miocene-late Eocene calcareous nannofossil and planktonic foraminiferal datums.
F18. Age-depth plot of early Oligocene-late Paleocene calcareous nannofossil and planktonic foraminiferal datums.
F19. Age-depth plot of early Eocene-Maastrichtian calcareous nannofossil and planktonic foraminiferal datums.
F20. Mass accumulation rates vs. depth and age for the Maastrichtian-Pleistocene.
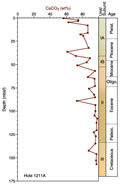
F21. Carbonate profile.
F22. Sodium and chloride profiles.
F23. Alkalinity, sulfate, ammonium, phosphate, iron, and manganese profiles.
F24. Potassium, calcium, magnesium, strontium, and lithium profiles.
F25. Silica profile.
F26. MST magnetic susceptibility.
F27. Whole-core MST GRA and discrete bulk density vs. depth.
F28. Whole-core MST and discrete P-wave velocity vs. depth.
F29. Discrete P-wave velocities.
F30. P-wave velocities vs. wet bulk density.
F31. Water content, porosity, and void ratio vs. depth.
F32. Wet bulk, dry, and grain density vs. depth.
T1. Coring summary.
T2. Calcareous nannofossil datums, ages, and depths.
T3. Planktonic foraminifer datums, ages, and depths.
T4. Cenozoic and Cretaceous benthic foraminifers, Hole 1211A.
T5. Cenozoic and Cretaceous benthic foraminifers, Hole 1211B.
T6. Composite depth section.
T7. Splice tie points.
T8. Linear sedimentation rate segments and average accumulation rates.
T9. Headspace CH4 concentrations.
T10. Carbonate contents.
T11. Results of geochemical analyses.
T12. Discrete index properties measurements.
T13. Discrete measurements of P-wave velocity.