![]() Figures F1-F10
Figures F1-F10
![]() Tables
T1-T9
Tables
T1-T9
F1. Example of coring and depth intervals.
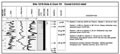
F2. Example of an AppleCORE summary barrel sheet.
F3. Key to symbols used for graphic lithologies.
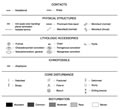
F4. Key to other symbols used on the computer-generated core-description forms.
F5. Ternary diagram showing nomenclature for principal components of whole-rock composition.
F6. Grain-size divisions for sedimentary rocks.
F7. Correlation chart for 0-65 Ma.
F8. MS data, Site 1218.
F9. CaCO3 determined by ICP-AES and coulometer analyses.
F10. Schematic illustration of tool strings.
T1. Age estimates of calcareous nannofossil datum events.
T2. Age estimates of planktonic foraminifer datum events.
T3. Age estimates of radiolarian datum events.
T4. Magnetic polarity timescale used during Leg 199.
T5. Example of composite depth table.
T6. Example of splice tie points table.
T7. Analytical determination reproducibility.
T8. Deployed logging tools.
T9. Logging tool acronyms and units.