![]() Figures F1-F25
Figures F1-F25
![]() Tables
T1-T16
Tables
T1-T16
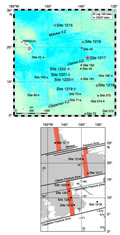
F1. Site location map.
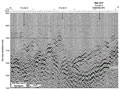
F2. Seismic reflection profile.
F3. Lithologic summary.
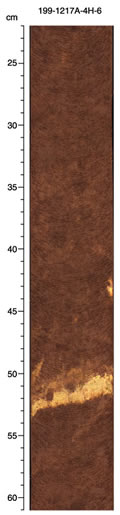
F4. Unit I ash layer within nannofossil ooze.
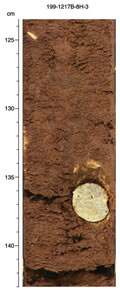
F5. Pumice pebble in Subunit IIA.
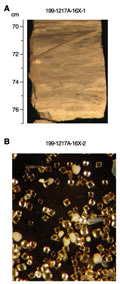
F6. Nannofossil chalk and dolomite rhombs.
F7. Carbonate data, DSDP Site 162.
F8. Distribution of biostratigraphic zones for radiolarians.
F9. Magnetization intensities after AF demagnetization.
F10. AF demagnetization of a discrete sample.
F11. Composite magnetic stratigraphy.
F12. GRA bulk density, magnetic susceptibility, color reflectance (L*), P-wave velocity, and natural gamma count data plotted vs. depth.
F13. GRA bulk density, magnetic susceptibility, color reflectance (L*), P-wave velocity, and natural gamma count data plotted vs. composite depth.
F14. Spliced records of GRA bulk density, magnetic susceptibility, color reflectance (L*), P-wave velocity, and natural gamma count data plotted vs. composite depth.
F15. Plot of biostratigraphic and paleomagnetic datum levels used to constrain average LSR vs. depth.
F16. Core EW9709-4P density compared with Site 1217 GRA density.
F17. Plot of all biostratigraphic and paleomagnetic datum levels.
F18. Interstitial water data.
F19. Bulk-sediment data.
F20. MAD measurements.
F21. Wet and dry bulk density plotted with GRA bulk density.
F22. LAS mineralogy determinations.
F23. Compressional wave velocity.
F24. Natural gamma radiation.
F25. Magnetic susceptibility.
T1. Coring summary.
T2. Distribution of benthic foraminifers.
T3. Composite depths of geomagnetic reversals.
T4. Core disturbance intervals.
T5. Composite depth offsets.
T6. Splice tie points.
T7. Paleomagnetic datums.
T8. Nannofossil and radiolarian events.
T9. Linear sedimentation rates and mass accumulation rates for the major lithologic units.
T10. Interstitial water data.
T11. Bulk-sediment data.
T12. Calcium carbonate and organic carbon data.
T13. Moisture and density measurements.
T14. LAS-based mineralogy.
T15. Split-core velocity measurements.
T16. Thermal conductivity measurements.