![]() Figures
F1-F8
Figures
F1-F8
![]() Tables T1-T4
Tables T1-T4
F1. Site map.

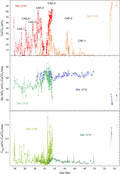
F2. CaCO3, biogenic SiO2, and Corg.
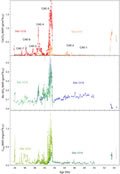
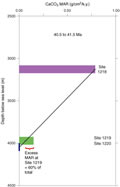
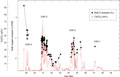
F3. CaCO3, biogenic SiO2, and Corg MARs.
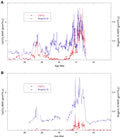
F4. Detail of interval from 43 to 37 Ma.
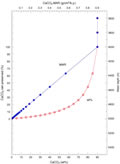
F5. CCD change estimated using percentages vs. CaCO3 MAR.
F6. CCD estimate based on Sites 1218, 1219, and 1220 over CAE-3.
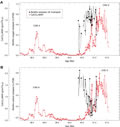
F7. Bulk oxygen isotopes and CaCO3.
F8. Oxygen and carbon isotope records.
T1. Corg, CaCO3, and opal, Site 1218.
T2. Corg, CaCO3, opal, and bulk 18O, Site 1219.
T3. Carbonate accumulation events.
T4. Changes in carbonate compensation depth.