![]() Figures
F1-F9
Figures
F1-F9
![]() Tables T1-T2
Tables T1-T2
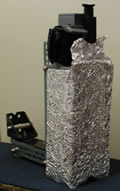
F1. Infrared camera.
F2. Air temperatures compared to core liner temperatures.
F3. Time of day and watch compared to core liner temperatures.
F4. Core liner temperatures for five cores.
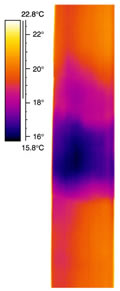
F5. Thermal contrast between hydrate and surrounding sediment.
F6. Temperatures of cores without and with hydrate.
F7. Thermal signatures suggestive of hydrate.
F8. Comparison of thermal data with physical property measurements, Hole 1230A.
F9. Comparison of thermal data with MST measurements, Hole 1226B.
T1. Core liner temperatures with hydrate and surrounding sediments.
T2. Average and standard deviation of core liner temperatures.