![]() Figures F1-F20
Figures F1-F20
![]() Figures
F21-F40
Figures
F21-F40
![]() Figures F41-F66
Figures F41-F66
![]() Tables
T1-T4
Tables
T1-T4
F1. Latitudinal range of Leg 202 drill sites.
F2. Cored intervals, ages, and water depths, Sites 1232-1242.
F3. Schematic of upper-ocean currents off the west coast of South America.
F4. Modern annual average values of sea-surface temperature, sea-surface phosphate, and sea-surface salinity.
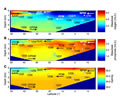
F5. Cross section of subsurface water masses, characterized by dissolved oxygen, dissolved phosphate, and salinity.
F6. Plate tectonic backtrack of Leg 202 drill sites.
F7. Core-log integration.
F8. Comparison of natural gamma radiation data from core logging and downhole logging, Site 1238.
F9. Comparison of GRA bulk density data from core logging and downhole logging density.
F10. Depth offsets of sequential cores vs. time of coring operation, Site 1240.
![]()
F11. Reflectance spectroscopy-derived CaCO3 and TOC contents compared to directly measured quantities, Site 1237.
F12. PSV records, Site 1233.
F13. PSV records, Site 1234.
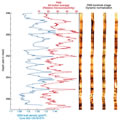
F14. Variations in paleomagnetic declination, inclination, and paleointensity at Site 1233, 0-136 mcd.
F15. Variations in paleomagnetic declination, inclination, and paleointensity at 1233, 15-65 mcd.
F16. Comparison of paleomagnetic inclination, declination, and paleointensity, Sites 1233 and 1234.
F17. Age models for Leg 202 sites.
F18. LSRs and MARs at Leg 202 sites.
F19. Site 1237 frequency spectrum of GRA density fluctuation for the time interval of ~3-4 Ma.
F20. Carbonate and noncarbonate MARs.
![]() Figures F1-F20
Figures F1-F20
![]() Figures
F21-F40
Figures
F21-F40
![]() Figures F41-F66
Figures F41-F66
![]() Tables
T1-T4
Tables
T1-T4