![]() Figures F1-F20
Figures F1-F20
![]() Figures F21-F40
Figures F21-F40
![]() Figures F41-F66
Figures F41-F66
![]() Tables
T1-T4
Tables
T1-T4
F41. Millennial-scale variability, Site 1233.
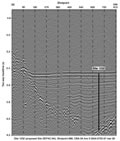
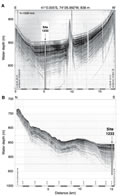
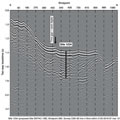
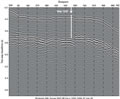
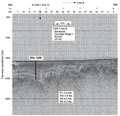
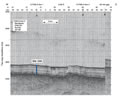
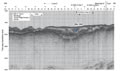
F42. Seismic profile across Site 1232.
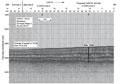
F43. Core recovery, lithology, age, and physical and chemical data summary, Site 1232.
F44. Digital Parasound profile, Site 1233.
F45. Analog 3.5-kHz profile acquired during the approach to Site 1233.
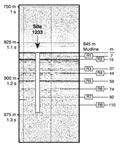
F46. Core recovery, lithology, age, and physical and chemical data summary, Site 1233.
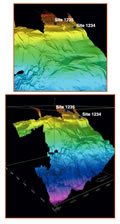
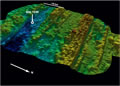
F47. Swath bathymetry of a Chile margin segment.
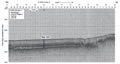
F48. Seismic profile across Site 1234.
F49. Core recovery, lithology, age, and physical and chemical data summary, Site 1234.
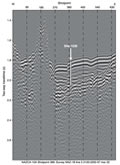
F50. Seismic profile across Site 1235.
F51. Core recovery, lithology, age, and physical and chemical data summary, Site 1235.
F52. Seismic profile across Site 1236.
F53. Core recovery, lithology, age, and physical and chemical data summary, Site 1236.
F54. Seismic profile across Site 1237.
F55. Core recovery, lithology, age, and physical and chemical data summary, Site 1237.
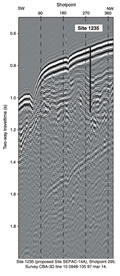
F56. Seismic profile across Site 1238.
F57. Core recovery, lithology, age, and physical and chemical data summary, Site 1238.
F58. Seismic profile across Site 1239.
F59. Core recovery, lithology, age, and physical and chemical data summary, Site 1239.
F60. Swath bathymetry of a Panama Basin segment.
F61. Seismic profile across Site 1240.
F62. Core recovery, lithology, age, and physical and chemical data summary, Site 1240.
F63. Seismic profile across Site 1241.
F64. Core recovery, lithology, age, and physical and chemical data summary, Site 1241.
F65. Seismic profile across Site 1242.
F66. Core recovery, lithology, age, and physical and chemical data summary, Site 1242.
T1. Leg 202 coring summary by site.
T2. Leg 202 coring summary by hole.
T3. Summary of APC drilling over.
T4. Summary of Leg 202 geochemistry.
![]() Figures F1-F20
Figures F1-F20
![]() Figures F21-F40
Figures F21-F40
![]() Figures F41-F66
Figures F41-F66
![]() Tables
T1-T4
Tables
T1-T4