![]() Figures F1-F20
Figures F1-F20
![]() Figures
F21-F40
Figures
F21-F40
![]() Figures F41-F66
Figures F41-F66
![]() Tables
T1-T4
Tables
T1-T4
F21. Biogenic opal and terrigenous sediment MARs as components of the noncarbonate MAR.
F22. Modern ocean properties at backtrack locations, Site 1236.
F23. Modern ocean properties at backtrack locations, Site 1237.
F24. Modern ocean properties at backtrack locations, Site 1239.
F25. Modern ocean properties at backtrack locations, Site 1238.
F26. Modern ocean properties at backtrack locations, Site 1241.
F27. Interstitial sulfate concentrations vs. depth.
F28. TN vs. TOC concentrations.
F29. TOC/TN ratios vs. TOC concentrations.
F30. Interstitial calcium and magnesium/calcium profiles vs. depth.
F31. Interstitial chloride vs. depth for Chile margin sites.
F32. Interstitial water profiles vs. depth, Site 1240.
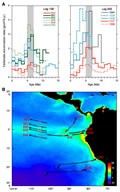
F33. Quartz distribution in surface sediments, siliciclastic accumulation rates, and hematite peak height.
F34. Mean calcium carbonate accumulation rates vs. age and annual chlorophyll-a concentrations.
F35. Ash frequency, Sites 1237-1242.
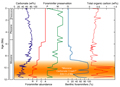
F36. CaCO3 concentration, foraminifer abundance and preservation, benthic foraminifer percentage, and TOC concentration, Site 1241.
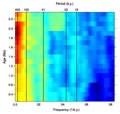
F37. Evolutive spectra of the lightness parameter L*, Site 1239.
F38. Surface water temperature and salinity contours, Sites 1232-1235.
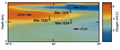
F39. Locations of Sites 1233-1235 on subsurface oxygen contours.
F40. Shipboard correlation of data, Sites 1233-1235.
![]() Figures F1-F20
Figures F1-F20
![]() Figures F21-F40
Figures F21-F40
![]() Figures F41-F66
Figures F41-F66
![]() Tables
T1-T4
Tables
T1-T4