![]() Figures F1-F20
Figures F1-F20
![]() Figures F21-F29
Figures F21-F29
![]() Tables
T1-T14
Tables
T1-T14
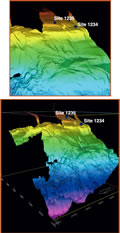
F1. Three-dimensional bathymetry image of Sites 1234 and 1235.
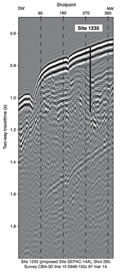
F2. Seismic profile at Site 1235.
F3. Sites 1232-1235 and oceanographic features off southern and central Chile.
F4. North-south cross section of water masses.
![]()
F5. MS vs. mcd.
F6. NGR, GRA bulk density, and MST-MS.
F7. A comparison of mbsf and mcd scales,.
F8. Lithostratigraphic summary.
F9. Siliciclastic, biogenic, and authigenic components.
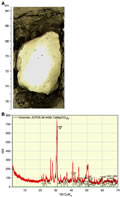
F10. Authigenic carbonate nodule.
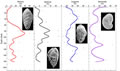
F11. Magnetic susceptibility and a*.
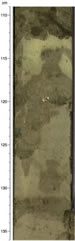
F12. Color transition and bioturbated sequence.
F13. Ash layer.
F14. Moisture and density.
F15. MAD and GRA bulk densities.
F16. Color measurements.
F17. First derivatives of reflectance.
F18. Calcareous nannofossils, planktonic and benthic foraminifers, and diatoms.
F19. Variations in percent of benthic foraminifers.
F20. Initial and demagnetized NRM.