![]() Figures F1-F20
Figures F1-F20
![]() Figures F21-F29
Figures F21-F29
![]() Tables
T1-T14
Tables
T1-T14
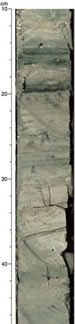
F21. Glauconite-bearing chalk color banding.
F22. Summary of depositional history, Site 1236.
F23. Calcareous nannofossils and planktonic and benthic foraminifers, Hole 1236A.
F24. NRM after AF demagnetization.
F25. NRM inclination after demagnetization.
F26. Inclination data and polarity interpretation correlated to the GPTS.
F27. Interstitial water geochemical data.
F28. Calcium carbonate vs. depth.
F29. Biostratigraphic and magnetostratigraphic datums and age-depth model.
T1. Operations summary, Site 1236.
T2. Composite depth scale, Site 1236.
T3. Splice tie points.
T4. OSUS-MS measurements, Hole 1236B.
T5. OSUS-MS measurements, Hole 1236C.
T6. Lithologic units.
T7. Age-depth control points.
T8. Distribution of calcareous nannofossils.
T9. Distribution of foraminifers.
T10. Polarity chron boundaries.
T11. Paleomagnetic age control points.
T12. Interstitial water geochemical data, Hole 1236A.
T13. IC, CaCO3, and TC concentrations, Hole 1236A.
T14. Age-depth model, LSRs, and MARs.
![]() Figures F1-F20
Figures F1-F20
![]() Figures
F21-F29
Figures
F21-F29
![]() Tables
T1-T14
Tables
T1-T14