![]() Figures F1-F20
Figures F1-F20
![]() Figures
F21-F37
Figures
F21-F37
![]() Tables
T1-T16
Tables
T1-T16
F21. Calcareous nannofossils and foraminifer abundance, Hole 1239A.
F22. Initial and AF demagnetized NRM.
F23. NRM intensity before and after AF demagnetization, 0-10 mcd.
F24. NRM intensity before demagnetization.

F25. NRM inclinations and declinations.
F26. Headspace methane, C1/C2, and CO2.
F27. Interstitial water geochemical data.
F28. Calcium carbonate, TOC, TOC CFB, TN, and TOC/TN vs. depth.
F29. CaCO3 vs. TOC and TN vs. TOC.
F30. Logging tool string deployments.
F31. Caliper, deviation, and gamma ray records.
F32. Density, porosity, sonic velocity, and resistivity data.

F33. Log and core density vs. eld.
F34. Log and core natural gamma radiation vs. eld.
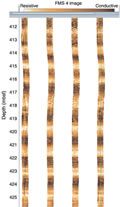
F35. FMS image of illustrating the meter-scale banding.
F36. Total and spectral gamma ray records.
F37. Shipboard biostratigraphic and magnetostratigraphic datums and age-depth model.
T1. Operations summary, Site 1239.
T2. Composite depth scale.
T3. Splice tie points.
T4. OSUS-MS measurements, Hole 1239A.
T5. OSUS-MS measurements, Hole 1239B.
T6. OSUS-MS measurements, Hole 1239C.
T7. Lithologic Unit I.
T8. Ash layers.
T9. Age-depth control points.
T10. Distribution of calcareous nannofossils.
T11. Distribution of planktonic foraminifers.
T12. Distribution of diatoms.
T13. Headspace gas concentrations and C1/C2 ratios.
T14. Interstitial water geochemical data.
T15. IC, CaCO3, TC, TOC, TOC CFB, and TN concentrations, and TOC/TN ratios.
T16. Age-depth model, LSRs, and MARs.
![]() Figures F1-F20
Figures F1-F20
![]() Figures
F21-F37
Figures
F21-F37
![]() Tables
T1-T16
Tables
T1-T16