![]() Figures F1-F20
Figures F1-F20
![]() Figures
F21-F40
Figures
F21-F40
![]() Tables
T1-T16
Tables
T1-T16
F21. Laminated diatom ooze.
F22. Downhole distribution of volcaniclastic horizons.
F23. Volcaniclastic horizons, age vs. depth.
F24. Calcareous nannofossils and planktonic and benthic foraminifers.
F25. Initial and AF demagnetized NRM intensities.
F26. Initial and AF demagnetized NRM magnetic susceptibilities and intensities, 0-20 mcd.
F27. NRM inclinations and declinations.
F28. Declinations showing possible polarity transitions.
F29. Headspace methane vs. depth.
F30. Interstitial water geochemical data.
F31. Calcium carbonate, TOC, TOC CFB, TN, and TOC/TN vs. depth.
F32. Logging tool string deployments.
F33. Caliper, deviation, and gamma ray records.
F34. Sonic velocity, resistivity, density, and porosity data.
F35. Log and core density.
F36. Total and spectral gamma ray records.
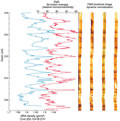
F37. Density and resistivity logs and scatter plot.
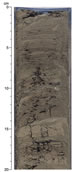
F38. FMS image illustrating the meter-scale banding.
F39. DIT vs. FMS resistivity.
F40. Biostratigraphic and magnetostratigraphic datums and age-depth model.
T1. Operations summary, Site 1241.
T2. Composite depth scale.
T3. Splice tie points.
T4. OSUS-MS measurements, Hole 1241A.
T5. OSUS-MS measurements, Hole 1241B.
T6. OSUS-MS measurements, Hole 1241C.
T7. Lithologic Unit I.
T8. List of ash layers.
T9. Distribution of calcareous nannofossils.
T10. Age-depth control points.
T11. Distribution of planktonic foraminifers.
T12. Distribution of diatoms.
T13. Headspace gas concentrations.
T14. Interstitial water geochemical data.
T15. IC, CaCO3, TC, TOC, TN, TOC CFB, and concentrations, and TOC/TN ratios.
T16. Age-depth model, LSRs, and MARs.
![]() Figures F1-F20
Figures F1-F20
![]() Figures
F21-F40
Figures
F21-F40
![]() Tables
T1-T16
Tables
T1-T16