![]() Figures F1-F20
Figures F1-F20
![]() Figures
F21-F31
Figures
F21-F31
![]() Tables
T1-T14
Tables
T1-T14
F1. Bathymetric map.
F2. Lithostratigraphic summary.

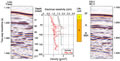
F3. East-west seismic reflection profile.
F4. Authigenic carbonate.
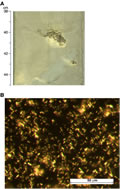
F5. Volcanic glass horizon.

F6. Volcanic glass shards.

F7. Age-depth plots.

F8. Concentration profiles of dissolved species in pore water.
F9. Chloride concentration profile.
F10. Lithium concentration.

F11. Profiles of iron.
F12. Headspace gas concentrations of C1, C2, C2=, and C3 vs. depth.

F13. Dissolved residual methane and sulfate in pore water.
F14. Concentrations of C1, C2, C3, and i-C4 vs. depth.
F15. C1/C2 ratio vs. depth.
F16. Downcore variation in IC, OC, TN, TS, and C/N ratios.
F17. Downcore temperature.

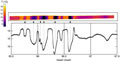
F18. Comparison of IR anomalies and Sw.

F19. Hydrate anomaly.
F20. Physical property data.
![]() Figures F1-F20
Figures F1-F20
![]() Figures
F21-F31
Figures
F21-F31
![]() Tables
T1-T14
Tables
T1-T14