![]() Figures F1-F20
Figures F1-F20
![]() Figures
F21-F31
Figures
F21-F31
![]() Tables
T1-T14
Tables
T1-T14
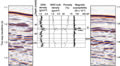
F21. 3-D seismic and physical properties.
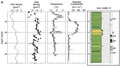
F22. Sedimentology and physical properties.
F23. Downhole measurements of resistivity.
F24. Comparison of VP with NCR and bulk density.

F25. Raw data for estimating in situ temperatures.

F26. Subsurface temperatures plotted vs. depth.
F27. Temperatures recorded during APCT tool calibration.
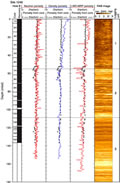
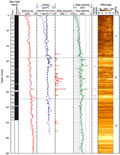
F28. LWD logs.
F29. LWD data.

F30. LWD- and core-derived porosities.
F31. Logging-derived gas hydrate saturations.
T1. Hole locations.
T2. Bioevents.
T3. Dissolved species in pore waters.
T4. C1, C2, C3.
T5. Concentrations of light hydrocarbon and nonhydrocarbon gases from core gas voids.
T6. Light hydrocarbons and nonhydrocarbons from gas hydrate.
T7. Contents of IC, OC, TN, and TS, and C/N ratios.
T8. Rock-Eval pyrolysis of samples.
T9. IR anomalies.
T10. Moisture and density.
T11. VP data.
T12. Thermal conductivity.
T13. Shear strength data.
T14. Temperature measurements.
![]() Figures F1-F20
Figures F1-F20
![]() Figures
F21-F31
Figures
F21-F31
![]() Tables
T1-T14
Tables
T1-T14