![]() Figures F1-F20
Figures F1-F20
![]() Figures F21-F41
Figures F21-F41
![]() Tables T1-T15
Tables T1-T15
F1. Bathymetric map.
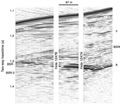
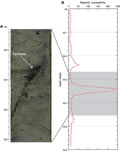
F2. Seismic characteristics of Horizon A.
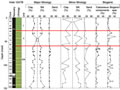
F3. Lithostratigraphic summary.
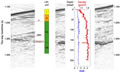
F4. Seismic reflection profile and LWD data.
F5. Authigenic carbonate cement.
F6. CaCO3 vs. depth.
F7. XRD record from carbonate samples.
F8. Pyrrhotite vein.
F9. Debris flow deposit.
F10. Sandy turbidite.
F11. Age-depth plot.
F12. Dissolved species in pore waters.
F13. Chloride concentration profile.
F14. Sulfate and methane concentration profiles.
F15. Lithium concentration profile.
F16. C1, C2, C3, and C2= vs. depth.
F17. Residual methane and sulfate in pore water.
F18. Light hydrocarbons vs. depth.
F19. C1/C2 ratio vs. depth.
F20. C1/C2 ratio vs. temperature.
![]() Figures F1-F20
Figures F1-F20
![]() Figures F21-F41
Figures F21-F41
![]() Tables T1-T15
Tables T1-T15