![]() Figures F1-F20
Figures F1-F20
![]() Figures F21-F41
Figures F21-F41
![]() Tables
T1-T15
Tables
T1-T15
F21. IC, OC, TN, TS, and C/N ratios.
F22. Downhole temperature profile.
F23. Comparison of temperature anomalies in the IR profile and Sw.
F24. Physical properties.
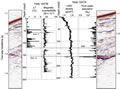
F25. Comparison of physical properties and IR temperature anomalies with 3-D seismic data.
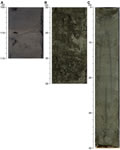
F26. Relation of bulk density to sedimentologic structure of sediment.
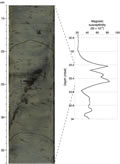
F27. Sulfide vein and MS profile.
F28. Raw data for estimating in situ temperatures.
F29. Subsurface temperatures plotted vs. depth.
F30. Volume-pressure-time plots for PCS.
F31. Methane concentrations.
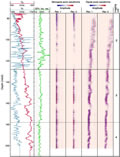
F32. LWD logs.
F33. LWD data.
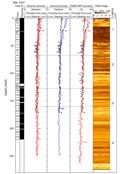
F34. CWL data.
F35. CWL gamma ray logging data.
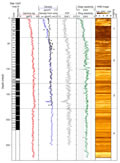
F36. LWD and CWL downhole logging data.
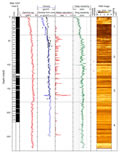
F37. CWL acoustic logging data.
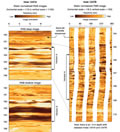
F38. RAB image showing Horizon A.
F39. LWD- and core-derived porosities.
F40. LWD-derived water saturations.
F41. Borehole temperatures.
T1. Coring summary.
T2. Bioevents.
T3. Dissolved species in pore waters.
T4. C1, C2, and C3.
T5. Light hydrocarbon and nonhydrocarbon gases.
T6. Gas from decomposed gas hydrate.
T7. Composition of PCS gas samples.
T8. IC, TC, OC, TN, and TS, and C/N ratios.
T9. Rock-Eval pyrolysis of samples.
T10. IR anomalies.
T11. MAD data.
T12. Thermal conductivity.
T13. Temperature measurements.
T14. Results from degassing experiments.
T15. CWL operations summary.
![]() Figures F1-F20
Figures F1-F20
![]() Figures
F21-F41
Figures
F21-F41
![]() Tables
T1-T15
Tables
T1-T15