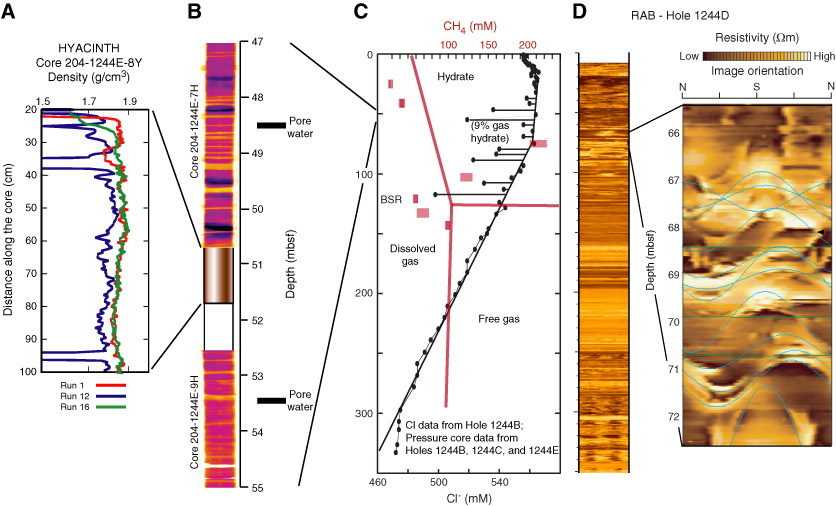
Figure F8. A. Gamma density profiles of a HYACINTH pressure core for ODP Leg 204 as pressure was released (Tréhu, Bohrmann, Rack, Torres, et al., 2003). At in situ conditions, a gas hydrate–rich zone at ~37 cm appears as a small low-density anomaly (run 1). Density decreases dramatically as pressure is released and the gas hydrate decomposes (run 12). After the core has been degassed, the bulk density of the sediment without hydrate is measured (run 16). B. IR image of several meters of core on either side of the HYACINTH pressure core. Dark horizontal lines represent cold anomalies (8°C) resulting from gas hydrate decomposition; yellow lines represent warm anomalies (14°C) resulting from voids due to gas expansion; background core temperature (pink) is ~12°C. There are no indications of gas hydrate in the upper 30 m, and gas hydrate is found in clusters of thin lenses spaced 2–3 m apart on average between 30 mbsf and the bottom-simulating reflector (BSR). The approximate length and spacing of pore water samples is also shown to illustrate the spatial relationship between the distribution of gas hydrate lenses to the spacing of pressure core and pore water samples (Tréhu et al., 2004b). C. Cl– concentration measured in Hole 1244C (black dots). In contrast to Figures F6 and F7, the concentrations in this figure have not been converted to gas hydrate amount as a percentage of pore space to illustrate the sensitivity of these estimates to assumptions about the background Cl– concentration (Ussler and Paull, 2001). If the pore water Cl– concentration is assumed to be the same as seawater, a gradually increasing amount of gas hydrate with depth, superimposed on discrete lenses of higher concentration, is determined. Torres et al. (2004a) argue that the Cl– concentration at SHR decreases with depth because of the input of freshwater from clay dehydration at depth and that the appropriate baseline should be defined as the envelope of the data (black line, referred to as the empirical baseline model). Assuming an empirical baseline, only discrete lenses with gas hydrate content up of up to 9% of the pore space (averaged over a 5- to 10-cm-long sample) are present at this site. The empirical baseline model is generally compatible with other gas hydrate proxy data from Leg 204 (Tréhu et al., 2004b). Methane concentration from pressure core data (red boxes) are overlain on the Cl– data along with the gas hydrate phase diagram (red lines). Two pressure cores at this site likely contained gas hydate. D. Resistivity-at-the-bit (RAB) data from LWD operations in Hole 1244D. A detail from 66 to mbsf is shown as well as an image of the entire hole. Bright regions (high resistivity) are indicative of gas hydrate when they also correspond to low-density zones. The detail shows considerable azimuthal variation in gas hydrate distribution, suggesting that the gas hydrate forms in steeply dipping faults and fractures in this interval (Janik et al., 2003; Weinberger and Brown, 2006). It is interesting to note that the zone of dipping hydrate lenses suggested by the RAB data in Hole 1244D corresponds to a depth interval with only very small Cl– anomalies in Hole 1244B, suggesting strong horizontal, as well as vertical, heterogeneity in hydrate distribution.