![]() Figures F1-F50
Figures F1-F50
![]() Figures
F51-F100
Figures
F51-F100
![]() Figures
F101-F150
Figures
F101-F150
![]() Figures
F151-F198
Figures
F151-F198
![]() Tables
T1-T46
Tables
T1-T46
F1. Basement age vs. penetration depth.

F2. Basement penetration depths by spreading rate.
F3. Age map of the Cocos and Pacific plates.
F4. Depth to axial low-velocity zone vs. spreading rate.
F5. Site 1256 at 14 Ma.
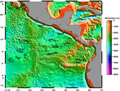
F6. Bathymetry for Site 1256 and the Cocos plate.
F7. Isochrons inferred from magnetic anomalies.
F8. Track map for Site 1256.
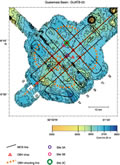
F9. Track map for proposed Site GUATB-02.

F10. Hole 1256D reentry cone.
F11. Casing string and reentry cone.

F12. Location map showing Site 1256 holes.

F13. Bi-center and tricone bits.
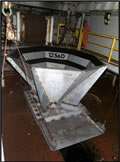
F14. A junk basket.
F15. "Junk" recovered from the hole.

F16. Reentry cone and casing.

F17. Lithostratigraphic column.

F18. Composite summary.

F19. Smear slide data summary, Hole 1256B.
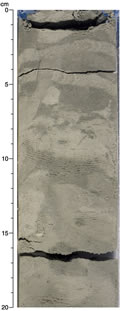
F20. Ash layer.
F21. Zoophycos burrows.
F22. Susceptibility, magnetic intensity, chromaticity, and carbonate.
F23. Diatom mat.

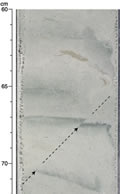
F24. Glauconite bands.
F25. Age-depth plot.

F26. Susceptibility data.

F27. Comparison of susceptibility data.

F28. Inclination, declination, and intensity.
F29. AF demagnetization results.

F30. Angular distance estimated by PCA and stable endpoints.

F31. Declinations estimated by PCA and stable endpoints.
F32. AF demagnetization results for 206-1256B-1H-3, 91 cm.
F33. AF demagnetization results for 206-1256B-3H-3, 121 cm.
F34. AF demagnetization results for 206-1256B-4H-3, 111 cm.
F35. AF demagnetization results for 206-1256B-8H-3, 81 cm.

F36. AF demagnetization results for 206-1256B-13H-3, 62 cm.
F37. Lowrie-Fuller tests.
F38. Magnetostratigraphy, inclination, and declination.
F39. Magnetostratigraphy and declination.
F40. Sedimentation rates.
F41. Salinity, Cl, Na, Na/Cl, and pH.
F42. Alkalinity, sulfate, dissolved organic carbon, ammonia, and Si.

F43. Ca, Mg, Sr, K, Li, and Mn.
F44. Cation ratios.
![]()
F45. Calcium carbonate, organic carbon, terrigenous matter, and biogenic silica.
F46. Major and trace elements.
F47. MARs of biogenic silica, terrigenous matter, and calcium carbonate.

F48. Depth and age profile of Ba/Ti ratios.
F49. Moisture and density and P-wave velocity.
F50. Magnetic susceptibility, NGR, and thermal conductivity.
![]() Figures F1-F50
Figures F1-F50
![]() Figures
F51-F100
Figures
F51-F100
![]() Figures
F101-F150
Figures
F101-F150
![]() Figures
F151-F198
Figures
F151-F198
![]() Tables
T1-T46
Tables
T1-T46