![]() Figures F1-F50
Figures F1-F50
![]() Figures
F51-F100
Figures
F51-F100
![]() Figures
F101-F150
Figures
F101-F150
![]() Figures
F151-F198
Figures
F151-F198
![]() Tables
T1-T46
Tables
T1-T46
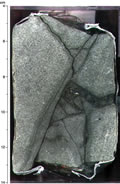
F151. Conjugate set of veins.
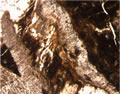
F152. Shear vein and overlapping saponite fibers.
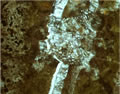
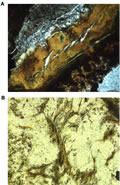
F153. Stretched carbonate fibers.
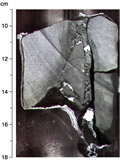
F154. Composite ataxial vein.
F155. Tension gashes and sheared saponite fibers.
F156. Saponite fibers and plagioclase in microfault.
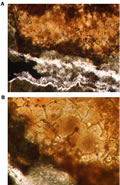
F157. Hyaloclastite breccia and altered glassy shards.
F158. Talus breccia.
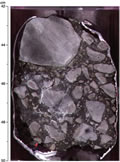
F159. Breccia with basaltic and glassy clasts.
F160. Incipient brecciation.
F161. Incipient brecciation.
F162. Distribution of true dip angles, Hole 1256C.
F163. True dip values of all oriented structures.
F164. Distribution of true dip angles, Hole 1256D.
F165. True dip values for late magmatic and shear veins.
F166. AF demagnetization plots, Hole 1256C.
F167. AF demagnetization plots, Hole 1256D.
F168. Thermal demagnetization plots.
F169. Whole-core susceptibility before demagnetization.
F170. Split-core intensities after demagnetization.
F171. Subsampling of the whole-round core.
F172. Summary of whole-round results.
F173. Working-half vs. archive-half demagnetization.
F174. Paleomagnetism quality index.
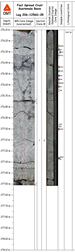
F175. PFT calibration curve.
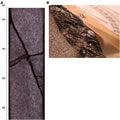
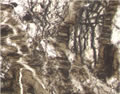
F176. Irregular filaments in vein cutting basalt.
F177. Physical properties, Hole 1256C.
F178. Physical properties, Hole 1256D.
F179. NGR, susceptibility, and thermal conductivity, Hole 1256C.
F180. NGR, susceptibility, and thermal conductivity, Hole 1256D.
F181. Velocity-density relationship.
F182. Porosity-density systematics.
F183. Porosity-velocity systematics.
F184. Anisotropy.
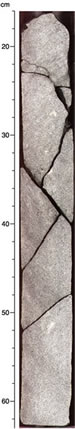
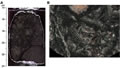
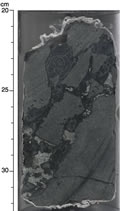
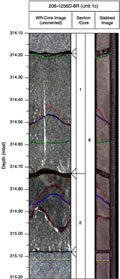
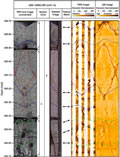
F185. Whole-round digital image with slabbed image.
F186. Whole-round digital image.
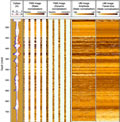
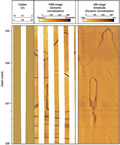
F187. Unrolled DMT and FMS/UBI images.
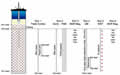
F188. Logging operations in Hole 1256D.
F189. Summary of downhole logging results.
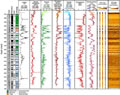
F190. Downhole logging results.
F191. Comparison of four GPIT runs.
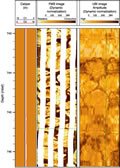
F192. Comparison of FMS and UBI images.
F193. FMS and UBI images of massive Unit 1256D-1.
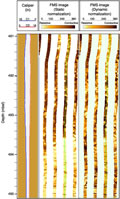
F194. FMS image of a typical pillow.
F195. FMS image of hyaloclastite to massive unit transition.
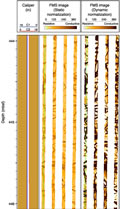
F196. FMS and UBI images of massive flows.
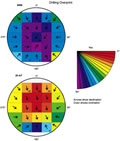
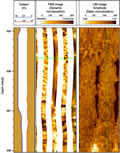
F197. FMS and UBI images of a breakout.
F198. Magnetic subdivisions derived from inclination.
T1. Operation acronyms.
T2. Leg 206 operations.
T3. Site 1256 coring summary.
T4. Site 1256 operations summary.
T5. Sedimentary overburden units.
T6. XRD results, Hole 1256B.
T7. Calcareous nannofossils.
T8. Epoch boundaries.
T9. Calcareous nannofossil distribution chart.
T10. Disturbed intervals and voids.
T11. Paleomagnetic data, Hole 1256A.
T12. Paleomagnetic data, Hole 1256B.
T13. Paleomagnetic data, Hole 1256C.
T14. PCA and stable endpoints, Holes 1256A and 1256B.
T15. Discrete sample paleomagnetic data, Hole 1256B.
T16. PCA and stable endpoints, Hole 1256B.
T17. ARM on discrete samples.
T18. IRM on discrete samples.
T19. Core orientation angles.
T20. Magnetostratigraphy, Site 1256.
T21. Linear sedimentation rates, Site 1256.
T22. Interstitial water geochemical data.
T23. Bulk sediment geochemical data.
T24. Lithology from VNIS, Hole 1256B.
T25. Heat flow data, Hole 1256B.
T26. Unit log, Hole 1256C.
T27. Unit log, Hole 1256D.
T28. Locations of glass and altered glass.
T29. Modal analyses of basalt.
T30. Digital photomicrograph log.
T31. Average maximum grain size in massive lava.
T32. ICP-AES analyses, Hole 1256C.
T33. ICP-AES analyses, Hole 1256D.
T34. ICP-AES analyses for BAS-148 and 206.
T35. XRD results.
T36. Paleomagnetic data from discrete samples.
T37. Paleomagnetic data from archive halves, Hole 1256C.
T38. Paleomagnetic data from archive halves, Hole 1256D.
T39. Paleomagnetic data from archive-half rocks.
T40. Samples used in the overprint experiment.
T41. Paleomagnetic summary by igneous unit.
T42. Microbiology samples, Hole 1256D.
T43. Quantification of microspheres, Hole 1256C.
T44. Discrete physical properties, Holes 1256C and 1256D.
T45. Whole-round digital image scanner piece log.
T46. WST summary listing.
![]() Figures F1-F50
Figures F1-F50
![]() Figures
F51-F100
Figures
F51-F100
![]() Figures
F101-F150
Figures
F101-F150
![]() Figures
F151-F198
Figures
F151-F198
![]() Tables
T1-T46
Tables
T1-T46