![]() Figures F1-F20
Figures F1-F20
![]() Figures F21-F33
Figures F21-F33
![]() Tables T1-T22
Tables T1-T22
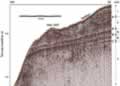
F1. Seismic reflection line M49-4.
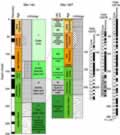
F2. Comparison Sites 144 and 1257.
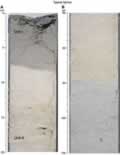
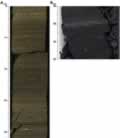
F3. Lithologies from Units I and II.
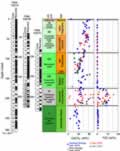
F4. Carbonate and organic carbon.
F5. Lithology of pelagic sediments in Unit III.
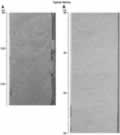
F6. Lithologies of Units IV and V.
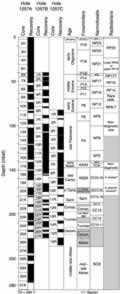
F7. Microfossil biozonation.
F8. Shipboard paleomagnetic data.
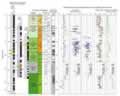
F9. Shore-based paleomagnetic data.
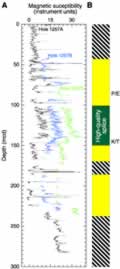
F10. Magnetic susceptibility.
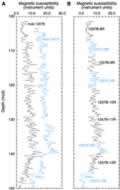
F11. Upper Paleocene magnetic susceptibility.
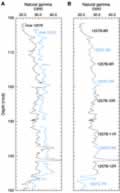
F12. NGR and spliced magnetic susceptibility.
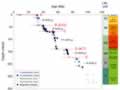
F13. Age-depth plot.
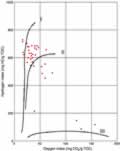
F14. Rock-Eval pyrolysis.
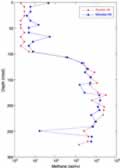
F15. Headspace gas methane concentrations.
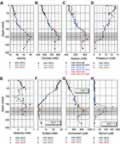
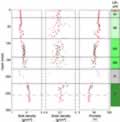
F16. Interstitial water profiles.
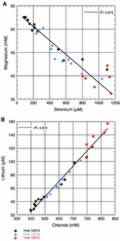
F17. Sr vs. Mg and Cl vs. Li.
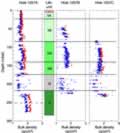
F18. Bulk density, grain density, and porosity.
F19. MAD vs. MST GRA density.
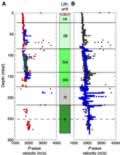
F20. Velocity measurements.
![]() Figures F1-F20
Figures F1-F20
![]() Figures F21-F33
Figures F21-F33
![]() Tables T1-T22
Tables T1-T22