![]() Figures F1-F20
Figures F1-F20
![]() Figures F21-F33
Figures F21-F33
![]() Tables T1-T22
Tables T1-T22
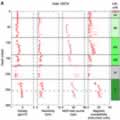
F21. MST data.
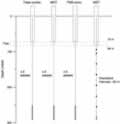
F22. Summary of logging runs.
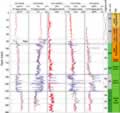
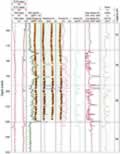
F23. Borehole caliper logs.
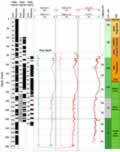
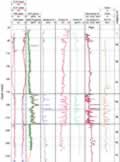
F24. Geophysical logs and physical properties.
F25. Geophysical logs, caliper data, and logging units.
F26. Logging Units 1 and 2.
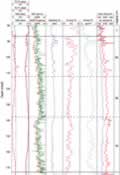
F27. High-resolution MGT gamma ray logs.
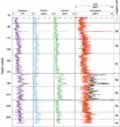
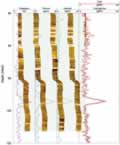
F28. Geophysical logs and FMS imagery.
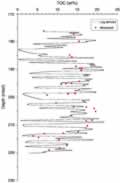
F29. Core-measured vs. log-calculated TOC.
F30. MGT gamma ray logs and FMS imagery.
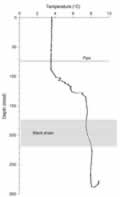
F31. Borehole temperature.
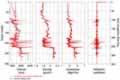
F32. Density, velocity, impedance, and reflection profiles.
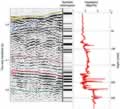
F33. Synthetic seismogram.
T1. Coring summary.
T2. Summary of lithology.
T3. Calcareous nannofossil datums.
T4. Planktonic foraminifer species.
T5. Planktonic foraminifer datums.
T6. Calcareous nannofossils.
T7. Planktonic foraminifer species.
T8. Planktonic foraminifer species.
T9. Shipboard paleomagnetic analyses.
T10. Polarity interpretations and ChRM.
T11. Composite depth offsets.
T12. Upper Paleocene splice tie points.
T13. Calcareous nannofossil and planktonic foraminifer datums.
T14. Magnetostratigraphic datums.
T15. LSRs and MARs.
T16. Carbon and nitrogen results.
T17. Rock-Eval pyrolysis.
T18. Headspace analyses.
T19. Interstitial water analyses.
T20. Index properties of discrete samples.
T21. Velocity measurements.
T22. Checkshot data.
![]() Figures F1-F20
Figures F1-F20
![]() Figures F21-F33
Figures F21-F33
![]() Tables T1-T22
Tables T1-T22