![]() Figures F1-F20
Figures F1-F20
![]() Figures F21-F32
Figures F21-F32
![]() Tables T1-T16
Tables T1-T16
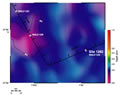
F1. Locations of Site 1262 and alternate sites.
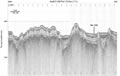
F2. Line GeoB 01-035 and Site 1262 in a perched basin.
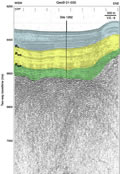
F3. Line GeoB 01-035 and Site 1262 with reflector ages.
F4. MS data.
F5. Mbsf vs. mcd plots.
![]()
F6. Smear slide components.
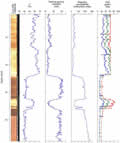
F7. MS, NGR, carbonate content, and L*.
F8. MS, NGR, GRA bulk density, and P-wave velocity data.
F9. Lightness, carbonate content, and chromaticity.
F10. Cycles observed in MS and L*.
F11. Grain density, bulk density, porosity, and P-wave velocity.
F12. Physical property measurements.
F13. P-wave velocities.
F14. Color reflectance data.
F15. Turbidites and gravity flows.
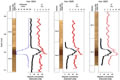
F16. Digital image, L*, RGB, MS, and NGR across the E/O boundary.
F17. Digital image, a*, and MS of the clay horizon.
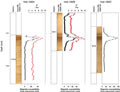
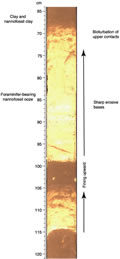
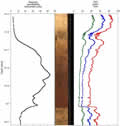
F18. Digital image, carbonate, MS, and red-green chromaticity across the P/E boundary.
F19. MS and color variations across the P/E boundary.
F20. MS across the P/E boundary.
![]() Figures F1-F20
Figures F1-F20
![]() Figures F21-F32
Figures F21-F32
![]() Tables T1-T16
Tables T1-T16