![]() Figures F1-F20
Figures F1-F20
![]() Figures F21-F32
Figures F21-F32
![]() Tables T1-T16
Tables T1-T16
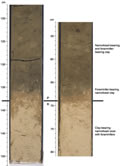
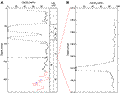
F21. K/P boundary, Holes 1262B and 1262C.
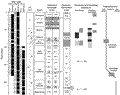
F22. Planktonic foraminiferal and calcareous nannofossil biozonations.
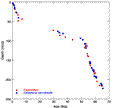
F23. Summary of sedimentation rates.
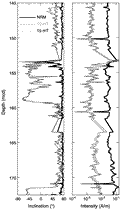
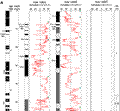
F24. Inclination and intensity data, Hole 1262B.
F25. Downhole variation in intensities, 0- and 15-mT demagnetization.
F26. Downhole variations in DRM, nDRM, ndDRM, and MS.
F27. Magnetostratigraphic interpretation.
F28. Discrete sample positions.
F29. Chemical constituents in interstitial waters.
F30. Carbonate contents vs. composite depth.
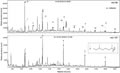
F31. Gas chromatogram.
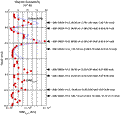
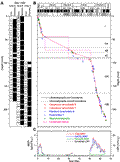
F32. Core recovery, age-depth model, and LSR and MAR.
T1. Coring summary.
T2. Composite depth scale.
T3. Splice tie points.
T4. Lithostratigraphic subdivisions.
T5. Selected calcareous nannofossil datums.
T6. Selected planktonic foraminiferal datums.
T7. Range and abundance of calcareous nannofossils.
T8. Range and abundance of planktonic foraminifers.
T9. Selected benthic foraminifers.
T10. Magnetostratigraphic age-depth tie points.
T11. Composition of headspace gas samples.
T12. Pore water analyses.
T13. Calcium carbonate and total and organic carbon.
T14. GC-MSD hydrocarbon peaks.
T15. Age-depth model, LSRs, and MARs.
T16. Datum levels.
![]() Figures F1-F20
Figures F1-F20
![]() Figures F21-F32
Figures F21-F32
![]() Tables T1-T16
Tables T1-T16