![]() Figures F1-F20
Figures F1-F20
![]() Figures F21-F37
Figures F21-F37
![]() Tables T1-T16
Tables T1-T16
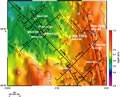
F1. Locations of Sites 1263 and 1264 and alternate sites.
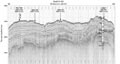
F2. Lines GeoB 01-031 and GeoB 01-046.
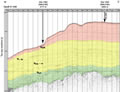
F3. Line GeoB 01-046 with age reflector estimates.
F4. MS data.
F5. MS of P/E boundary intervals.
F6. Differential stretching of APC and XCB cores.
F7. Mbsf vs. mcd plots.
![]()
F8. Parameters used to define lithostratigraphic units.
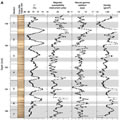
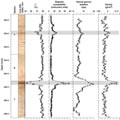
F9. MS, GRA bulk density, NGR, and PWL values.
F10. Lightness, carbonate content, and chromaticity.
F11. Smear slide components.
F12. Grain density, bulk density, porosity, and P-wave velocity.
F13. Physical property measurements.
F14. P-wave velocity data.
F15. Chromaticity, Mn and Fe, and grain density.
F16. Angular contact with an upper Neogene hiatus.
F17. Digital image, RGB color variations, L*, and MS across the E/O boundary.
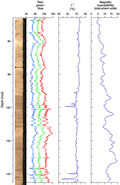
F18. Digital image, L*, MS, NGR, and bulk density from the Subunit IB cyclic interval.
F19. Large and small light-colored blebs.
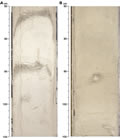
F20. Digital image, L*, MS, NGR, and bulk density of clay-enriched horizons.
![]() Figures F1-F20
Figures F1-F20
![]() Figures F21-F37
Figures F21-F37
![]() Tables T1-T16
Tables T1-T16