![]() Figures F1-F20
Figures F1-F20
![]() Figures F21-F37
Figures F21-F37
![]() Tables T1-T16
Tables T1-T16
F21. Digital images of P/E boundary sections.
F22. Planktonic foraminiferal and calcareous nannofossil biozonation.
F23. Sedimentation rates.
F24. Vector endpoint, intensity, and equal-area diagrams.
F25. Inclinations from discrete samples and half cores.
F26. Intensities, 0- and 15-mT demagnetization.
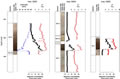
F27. Magnetostratigraphic interpretation.
F28. Chemical constituents in interstitial waters.
F29. Sedimentary carbonate contents.
F30. Logging operations.
F31. Quality of triple combo and FMS-sonic logs.
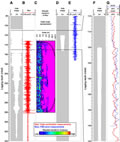
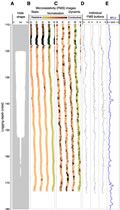
F32. Downhole logging stratigraphy, triple combo tool string.
F33. Wavelet transform of logs.
F34. Core-log integration.
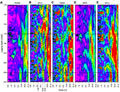
F35. FMS images and cyclostratigraphic limitations.
F36. Seismic modeling inputs.
F37. Age-depth model.
T1. Coring summary.
T2. Composite depth scale.
T3. Splice tie points.
T4. Lithostratigraphic subdivisions.
T5. Selected calcareous nannofossil datums.
T6. Range and abundance of calcareous nannofossils.
T7. Selected planktonic foraminiferal datums.
T8. Range and abundance of planktonic foraminifers.
T9. Selected benthic foraminifers.
T10. Magnetostratigraphic age-depth tie points.
T11. Composition of headspace gases.
T12. Interstitial water analyses.
T13. Sedimentary calcium carbonate and total and organic carbon.
T14. Logging operations, Hole 1263A.
T15. Datum levels.
T16. Age-depth model, LSRs, and MARs.
![]() Figures F1-F20
Figures F1-F20
![]() Figures F21-F37
Figures F21-F37
![]() Tables T1-T16
Tables T1-T16