RESULTS
The first step in analyzing the downhole measurements is to determine the noncompacted porosity,  0, and the long-term compressibility
  . Only two holes can be used for this purpose (Hole 975C and Hole 974C) because both exhibit a hydrostatically pressured upper compartment. The regular decrease in porosity with the depth of burial between the seafloor and 120 mbsf in these two cases is a clear indicator that the formations are hydrostatically pressured in this depth range (Fig. 4). For these two holes only, it appears that there is no free gas phase between 0 and 120 mbsf, as indicated by the agreement between the neutron porosity log and that derived from the density log (using
  = [1-] m + f). A nonlinear regression analysis based on Equation 8 is applied to Sites 974 and 975 (Fig. 4). The average noncompacted porosity and the characteristic depth are used in Equation 7 to calculate an average compressibility . Because a free gas phase was not detected in the formations between the seafloor and 120 mbsf at these two sites, we assume that f = w. Estimates of the long-term compressibility are = 1.41 x 10⁻⁷ Pa-1 in Hole 975C and = 3.35 x 10⁻⁷ Pa-1 in Hole 974C. Such a difference between the compressibility coefficient computed at these two sites is not completely surprising. A. Revil and L.M. Cathles (unpubl. data) noted an excellent correlation between the long-term compressibility, , and the average geothermal gradient, G, in sedimentary basins. The data reported by these authors show a very good linear correlation between the two parameters for geothermal gradients in the range 20°-40°C km-1. The geothermal gradient analyzed in Figure 5 from the equilibrium temperature distribution is two times greater in Hole 974C (G = 130.4°C km-1; Fig. 5) than in Hole 975C (G = 62.7°C km-1, Fig. 5). To estimate at the other sites where hydrostatic conditions were not observed, we used the following empirical formula relating to the geothermal gradient:
-
 , (21)
where 0 (= 1.86 x 10⁻⁸ Pa-1) is the long-term compressibility corresponding to a reference geothermal gradient G0 (20°C/km), and  = 15.37 x 10⁻². The temperature data reported by Comas, Zahn, Klaus, et al. (1996) are analyzed in Figure 5. The values of and 0 are calculated from the results obtained from the various holes investigated.
The compaction equation, Equation 8, can be solved using Equations 18 and 19 to test the ability of the model to reproduce both long and short length-scale porosity variations. The clay weight fraction of the formations is estimated from the gamma-ray log using Equation 20, and the noncompacted porosity is estimated from Equation 6. A test case of the model is illustrated in Figure 6. The porosity is at a maximum for the two end-members of the model (clean sand and pure shale) and at a minimum when clays fill the pores of the sand (center panel, Fig. 3). If we estimate the clay weight fraction of the formations from the gamma-ray log, we find that our compaction model is able to reproduce both long and short length-scale porosity variations (Fig. 6C). The good agreement between model and porosity data (Fig. 6C) indicates that the small-length scale porosity variations are effectively caused by lithologic variations related to shale content. In particular, the model reproduces the correlations and anticorrelations between the clay weight fraction and the porosity curve (Fig. 6A, Fig. 6B), depending on clay weight fraction (the limit being
 = 0.39 given by Equation 19 for the clay weight fraction between the "clayey sand domain" and the "sandy shale domain"). Porosity increases with increasing clay content if the clay fraction is >0.39, but decreases with increasing clay fraction if the clay fraction is <0.39.
Downhole measurements from Leg 161 are used to estimate the sedimentation rate, taking into account the compaction effects, and fluid overpressures (Fig. 7A, Fig. 7B, Fig. 7C, Fig. 7D). Using a simple mass balance argument, the uncompacted sedimentation rate,  0, can be estimated with the following equation (Magara, 1978):
-
 , (22)
where is the measured sedimentation rate between the depths z and (z +  h), that is:
-
 , (23)
where h is the difference in depth between two biostratigraphic markers, and t is the age difference between the same two biostratigraphic markers. Biostratigraphic markers are based on the first or last occurrence of calcareous nannofossils and planktonic foraminifers (Comas, Zahn, Klaus, et al., 1996). The porosities  and
and  are average porosity and average noncompacted porosity, respectively, between the depth z and (z + h) computed using
-
 , and (24)
-
-
 . (25)
The porosity distribution (z) is estimated from the neutron porosity log or from the density log corrected for the presence of gas. The noncompacted porosity distribution 0(z) is estimated from the gamma-ray log using Equations 18-20.
The excess porosity distribution is estimated for each borehole from the difference between the normal compaction trend computed from (derived from the geothermal gradient) and 0 (derived from the gamma-ray log). The lithostatic pressure is calculated by numerical integration of the density log and the water depth z:
-
 , (26)
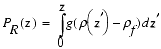
where is the density distribution of the sediment with depth z below the seafloor. The reduced lithostatic pressure is defined as the lithostatic pressure PR(z) minus the water hydrostatic pressure:
-
 . (27)
Using Equation 16, the fluid overpressure can be computed from the excess porosity. Porosity profiles can be computed from the density logs using (Ellis, 1987):
-
 . (28)
Because we use the approximation in f = in Equation 28 to limit the number of unknown parameters, the presence of gas appears on the density-derived porosity as high-frequency variations (see Fig. 7A, Fig. 7B, Fig. 7C). This is because the density of free gas is much smaller than the density of water. These high-frequency variations are removed before fluid overpressure is calculated. The validity of the fluid overpressure calculation from the porosity distribution and the present model has been checked by A. Revil and L.M. Cathles (unpubl. data) for sand/shale formations in the Gulf of Mexico coast, using mud weight data and borehole fluid pressure measurements. This method is valid only in the case where fluid overpressure results from disequilibrium compaction processes. In the wells presented here, the fluid overpressure estimates cannot be checked directly because direct fluid overpressure measurements were not obtained. However, because the Poisson ratio for long-term deformation of mud or unconsolidated sediments is close to 0.50 (Hamilton, 1971), the minimum horizontal stress should be close to the lithostatic load P. Consequently, the increase in fluid overpressure should be limited to the value of the reduced lithostatic stress itself. This prediction is verified in a particularly striking manner in Holes 975C and 977A (Fig. 7A, Fig. 7B).
In the case where the formations remain largely uncompacted near the surface (Holes 976B and 979A), it is also possible to compute the gas saturation using the gamma-ray log or as a combination of the neutron porosity and the density logs. Gas saturation appears to be very high below 120 mbsf in these two boreholes (Fig. 7C, Fig. 7D).
