![]() Figures 1-20
Figures 1-20
![]() Figures
21-40
Figures
21-40
![]() Figures
41-60
Figures
41-60
![]() Figures
61-68
Figures
61-68
![]() Tables
1-19
Tables
1-19
Figure 1. Bathymetry of part of the Iberia Abyssal Plain.
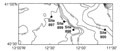
Figure 2. Contoured basement structure map showing location of Leg 149 sites.
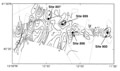
Figure 3. Migrated multichannel seismic reflection profile Sonne 75-16.
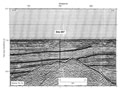
Figure 4. Multichannel seismic reflection and site-approach-survey track chart.
![]()
Figure 5. Migrated multichannel seismic reflection profile Lusigal Line 4.
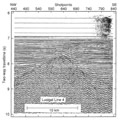
Figure 6. Migrated multichannel seismic reflection profile Lusigal Line 15.
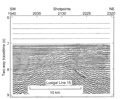
Figure 7. Bathymetric profile over a fault to the east-northeast of Site 897.
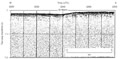
Figure 8. Master column for Site 897.
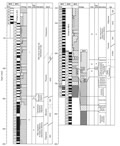
Figure 9. Regional stratigraphic correlation chart for Sites 897 to 900.
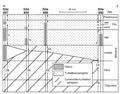
Figure 10. Depth. vs. age curve for Site 897.
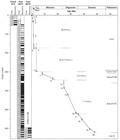
Figure 11. Turbidite sequences in Unit I.
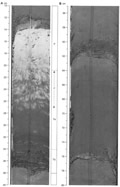
Figure 12. Turbidite sequences in Subunit IIB.
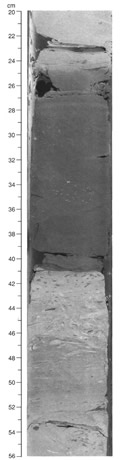
Figure 13. Upward-darkening sequences in Subunit IIC.
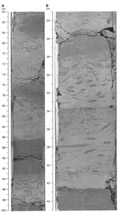
Figure 14. Reworking of sands by contour currents in Unit IIB.
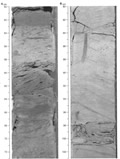
Figure 15. Sandy siltstone and sandy claystone at the top of Subunit IIIB.
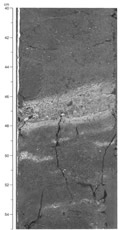
Figure 16. Polymictic conglomerates at the base of Subunit IIIB.
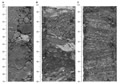
Figure 17. Base interval of Subunit IIIB.
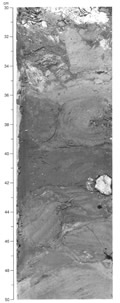
Figure 18. Breccia intervals in Unit IV.
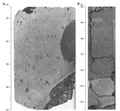
Figure 19. Core recover summary through Subunit IIIB and Unit IV.
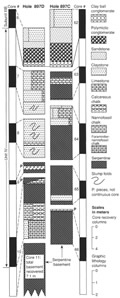
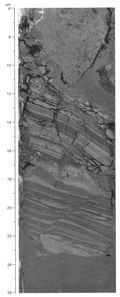
Figure 20. Fine siltstone in Unit IV with millimeter-scale faulting.
![]() Figures 1-20
Figures 1-20
![]() Figures
21-40
Figures
21-40
![]() Figures
41-60
Figures
41-60
![]() Figures
61-68
Figures
61-68
![]() Tables
1-19
Tables
1-19