![]() Figures 1-20
Figures 1-20
![]() Figures
21-32
Figures
21-32
![]() Tables
1-14
Tables
1-14
Figure 21. Headspace methane concentration.
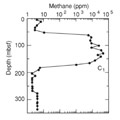
Figure 22. Sulfate, alkalinity, ammonia, and iron profiles for Site 898.
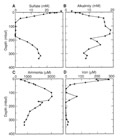
Figure 23. Manganese, calcium, magnesium, and strontium profiles for Site 898.
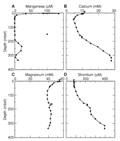
Figure 24. Potassium and silica profiles for Site 898.
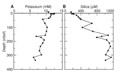
Figure 25. Physical properties summaries, Holes 898A and 898B.
![]()
Figure 26. Undrained shear strength measurements, Hole 898A.
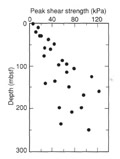
Figure 27. Acoustic velocity and anisotropy measurements, Hole 898A.
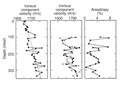
Figure 28. PWL acoustic velocity measurements, Hole 898A.
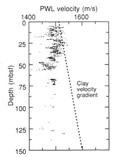
Figure 29. Thermal conductivity measurements, Holes 898A and 898B.
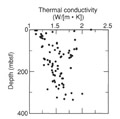
Figure 30. Expanded seismic reflection profile section from Lusigal Line 12.
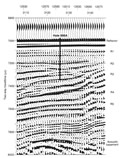
Figure 31. ADARA deployment at 113.7 mbsf, Hole 898A.
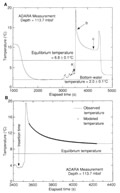
Figure 32. WSTP deployment at 177.4 mbsf, Hole 898A.
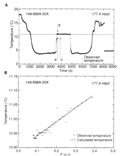
Table 1. Site 898 coring summary.
Table 2. Lithostratigraphic summary.
Table 3. Color variation of lithologies.
Table 4. Biostratigraphic data for Site 898.
Table 5. Planktonic foraminifer distribution, Hole 898A.
Table 6. Total, inorganic, and organic carbon concentrations from Holes 898A and 898B.
Table 7. Rock-Eval pyrolysis from lithologic Unit I, Site 898.
Table 8. Headspace gas analyses, Hole 898A.
Table 9. Interstitial water data.
Table 10. Index properties data from Holes 898A and 898B.
Table 11. Discrete acoustic velocity measurements, Hole 898A.
Table 12. Thermal conductivity data, Holes 898A and 898B.
Table 13. Depths of reflectors, Hole 898A.
Table 14. ADARA and WSTP temperature measurements and vertically integrated thermal resisitivity data.